
Claims
The Electricity group investigated several claims made by Jacobson et al. concerning electricity in New York State (NYS). These claims were as follows:
- There exists sufficient wind speed to provide 50% of NYS power generation
- There exists sufficient solar intensity to provide 38% of NYS power generation
- There exists sufficient hydroelectric capacity to provide 5.5% of NYS power generation
- There exist sufficient geothermal resources to provide 5% of NYS power generation
- By 2015, overall end-use electricity efficiency will increase by 15% in NYS
For each claim, the team conducted research to determine the veracity of the claim. The results of our investigation are detailed in the following sections. It should be noted that discussion of each claim begins with a description of the specifics of that claim, and that they all cite a figure of 60 GW for total NYS end-use power demand. This number is drawn from Table 1 in the report by Jacobson et al.
Wind
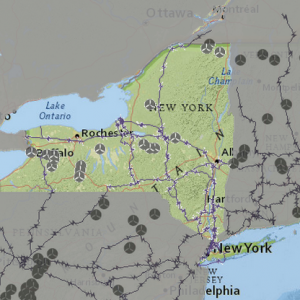
Figure 1: Location of current wind farms in NYS
Currently NYS creates a little under 2000MW of onshore wind power through current wind farms and 0MW of offshore wind power. A list to all operation on-shore wind farms can be found here.
Jacobson et al. claims that 50% of NYS electrical generation can be provided by wind turbines by 2030. The specifics of that claim are as follows:
- Total NYS end-use power demand would be 60 GW, meaning 30 GW of wind power
- 4,020 turbines would be on shore, and 12,700 turbines would be off shore
- On shore wind turbines would contribute 20% of wind generation, or 10% of the NYS total
- Off shore wind turbines would contribute 80% of wind generation, or 40% of the NYS total
- Every turbine, on shore or off shore, would be a 5 MW turbine
The primary question to answer in determining the veracity of this claim is whether there exists sufficient wind speed to generate the specified amount of power. This question can be divided into two sections, on shore and off shore.
On shore

Figure 2: On Shore Wind Speed at 80m
On shore wind turbines are different than off shore in two important ways. First, they take up land area, where off shore turbines are occupying space which would be unlikely to be developed. Second, on shore turbines tend to generate less power per turbine than their off shore counterparts due to the lower wind speeds. As a result, suitable locations for the development of on shore wind turbines will have to fulfill the following criteria:
- Sufficient wind speed (7.75 m/s according to Jacobson et al.)
- Open land (1.46% of the total NYS land area or 800 mi² according to Jacobson et al.)
Therefore, in our investigation of on shore wind generation capacity, we needed to answer the following question: Are there at least 800 square miles of open land with average wind speeds of at least 7.75 m/s in NYS?
To answer this question, we looked at data and maps produced by the National Renewable Energy Laboratory (NREL). The most important and helpful map was one from November 2010 detailing average on shore wind speeds at a height of 80 meters (see Figure 2), which is a good estimate for the height of a 5 MW turbine. In studying this map, it became clear that there are sufficient locations with wind speeds at or above 7.75 m/s, definitely above 800 square miles.
Our group also looked at the availability of the locations, as it would be more difficult to build where there is already development than where the land is open. We found that the large high-wind zone between Buffalo and Rochester is already home to several wind farms, though there are no wind generation facilities currently utilizing 5 MW turbines in NYS. Nonetheless, it is the opinion of our research group that there is sufficient land area with sufficient wind speed to accommodate 800 square miles of wind farm coverage.
Off shore

Figure 3: Off Shore Wind Speed at 90m
Off shore wind turbines are less restrained than on shore wind turbines, for the reasons noted above: The area they occupy is unlikely to be already developed, and off shore wind speeds are higher and more uniform. Nonetheless, the group applied the same rigor to off shore analysis, requiring that the following criteria be fulfilled:
- Sufficient wind speed (8.5 m/s according to Jacobson et al.)
- Sufficient space (4.62% of the total NYS land area or 2,520 mi² according to Jacobson et al.)
So the question here is simple: Are there at least 2,520 square miles of open sea with average wind speeds of at least 8.5 m/s available to NYS?
Once again, we turned to NREL for our primary data. The most helpful map for our research was a map of average off shore wind speed at a height of 90 meters (see Figure 3). This map shows that wind speed off shore is much more uniform and much higher than on shore, and it is clear that there is far more than enough space available. Many locations along the Atlantic, Lake Erie and Lake Ontario show potential for growth. Additionally construction of these turbines should follow two rules:
- Construction should occur in shallow water (<50m) in depth to aid in construction and transmission
- Sites should avoid avian flyways, shipping lanes, and waste sites. Excluding that area leaves us with 69% of the total available spacing for work. (Source)
The map provided by NREL helps to show the feasability since we still have enough space for turbines and most of the area for turbines is already in shallow water.
To conclude addressing the claims of the study it is technically feasible to achieve the Jacobson’s claims purely from a numerical point. Whether the timetable for 2030 is economically and politically feasible will be addressed now.
Can we hit these by 2030?
In the United State there are no operational offshore wind farms. The closest thing that we have to a offshore wind farm is the Cape Wind Project and even that has not seen a bit of construction. The timeline for the Cape Wind Project shows that on October 6 2010 after years of environmental review and consultation was a commercial lease to construct a wind farm granted. Now in 2015 Cape Wind still has to meed some lease stipulations and is undergoing litigation. Cape Wind is supposed to have a nameplate capacity of 468 MW and is expected to produce on average 174 MW. (Source) If we struggle to even get 1 project in operation it does not seem feasible to have 12,700 off shore turbines powering NYS. With no information within the US we have to look internationally, specifically at Europe which has made great strides with off shore wind. According to the European Wind Energy Association (EWEA) it takes approximately 6 months to create a wind farm with 50 MW nameplate capacity and 2 months to create a wind farm with 10 MW nameplate capacity. (Source) Going of this information creating 63,550 MW worth of turbines in 15 years seems highly unrealistic. The final point I would like to introduce is, do we have the supplies to create these wind turbines? In the United States there is only 1 wind turbine manufacturer. (Source). There are companies associated with construction, R&D, maintenance and operation and various other smaller roles.(Source) At this point even if we can get through the legal process to get approval for wind farms, we would then have to import lots of foreign material which takes time, and additionally construct the turbines which takes some more time.
Final conclusions that can be drawn is the meeting the Jacobson claims for 2030 is not feasible under our present political and economic parameters. Thus this would have to be changed. National Wildlife Federation recently issued a report outlining steps needed to be taken to speed up the process of off shore wind (see p. 3) A number of groups are also pushed for the federal Bureau of Ocean Energy Management to reject the proposal for a LNG facility in Pt. Ambrose off of Long Island and instead to allow off shore wind to proceed.
Solar
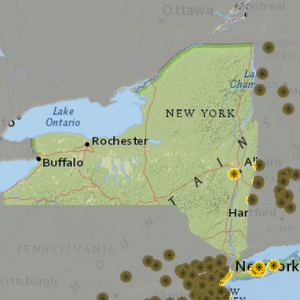
Figure 4: Location of Current Solar Power Plants in NYS
Jacobson et al. claims that 38% of NYS electrical generation can be provided by solar power by 2030. The specifics of that claim are as follows:
- Total NYS end-use power demand would be 60 GW, meaning 22.8 GW of solar power
- Solar generation would be provided in four different forms:
- 4.97 million residential rooftop photovoltaic (PV) systems
- 497,000 commercial/government rooftop PV systems
- 828 solar PV plants
- 387 concentrated solar power (CSP) plants
- Residential rooftop PV systems would contribute 15.8% of solar generation, or 6% of the NYS total
- Commercial/government rooftop PV systems would contribute 31.6% of solar generation, or 12% of the NYS total
- Solar PV plants would contribute 26.3% of solar generation, or 10% of the NYS total
- CSP plants would contribute 26.3% of solar generation, or 10% of the NYS total
The electricity group verifies Jacobson’s claims and finds that there is sufficient solar power available in NYS to meet the electrical demands.
Hydroelectric
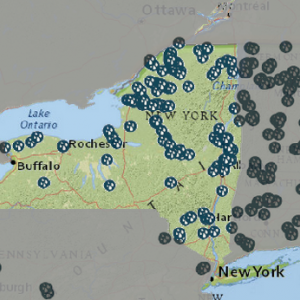
Figure 5: Location of Current Hydroelectric Plants in NYS
Jacobson et al. claims that 5.5% of NYS electrical generation can be provided by hydroelectric power by 2030. The specifics of that claim are as follows:
- Total NYS end-use power demand would be 60 GW, meaning 3.3 GW of hydroelectric power
- 6.6 plants of a rating of 1300 MW would be needed to meet this demand
- Currently 89% of the needed demand is already met by New York State at this time with plans to develop smaller scale hydroelectric plants throughout the rivers and Finger lakes.
- Current development of hydroelectric includes converting conventional dams to hydroelectric dams as well as upgrading current hydroelectric dams to increase capacity.
The primary question to answer in determining the veracity of this claim is whether there exists sufficient potential for hydroelectric generation capacity. Since New York State already meets 89% of the needed demand for 2030 and the current development of hydroelectric dams there is sufficient potential to meet the needs for New York State for hydroelectric generation.
Geothermal
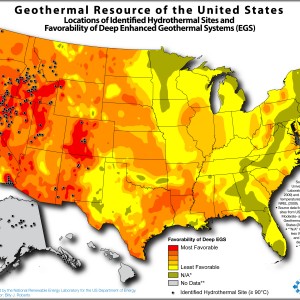
Figure 6: Geothermal Resource of the US
Jacobson et al. claims that 5% of NYS electrical generation can be provided by Geothermal power by 2030. The specifics of that claim are as follows:
- Total NYS end-use power demand would be 60 GW, meaning 3 GW of Geothermal power
- Each plant would generate 100 MW for a total of 3.6 GW of generation capacity
- Currently there are no Geothermal plant plans in New York State but there is a large potential for Geothermal energy as shown in the map for potential Geothermal source.
There exists sufficient geothermal energy to meet the electrical needs of NYS, but it suffers from the same issues as offshore wind and having the infrastructure ready by 2030 is not feasible.
Lazard Report
The Lazard Report version 8.0 in 2014 shows the trends of alternative energy cost when compared to fossil fuel cost. The following diagrams taken from the report summarize the cost comparison between alternative sources and fossil fuel sources.
Graph of Levelized Cost of Energy—Wind/Solar PV (Historical)
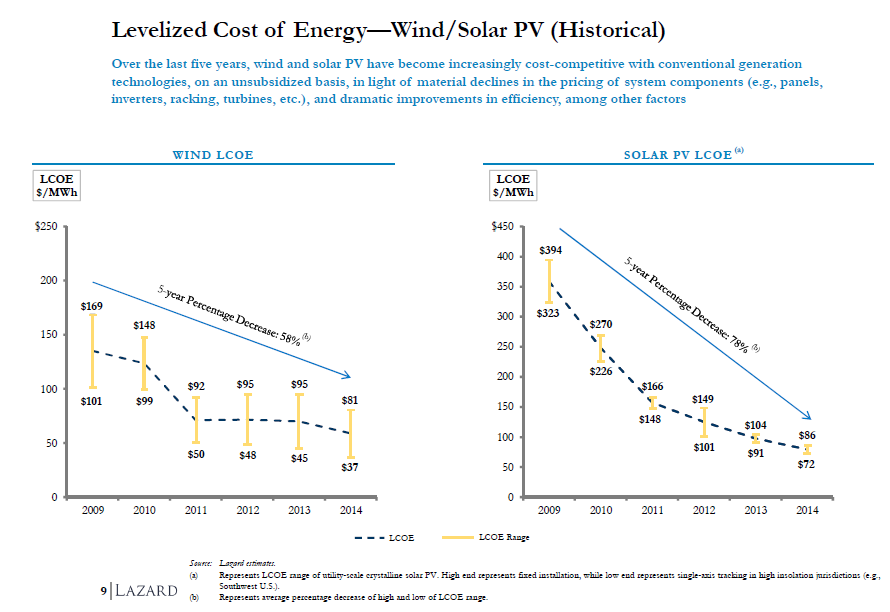
Figure 7: Levelized Cost of Energy Historical
Graph of Levelized Cost of Energy—Rooftop Solar (Forecasted)
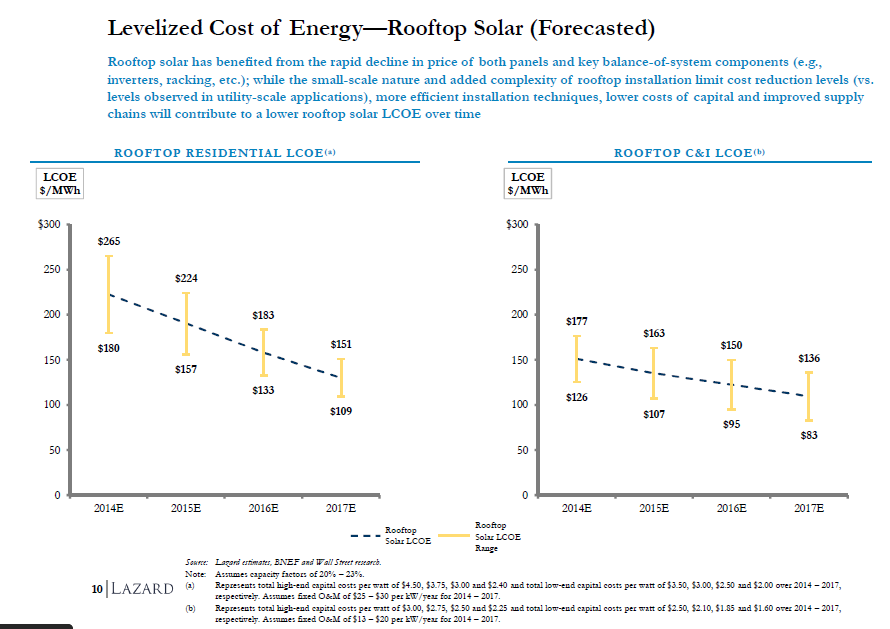
Figure 8: Levelized Cost of Energy Forecasted
Graph of Levelized Cost of Energy Components—Low End

Figure 9: Levelized Cost of Energy Low End
Graph of Levelized Cost of Energy Components—High End

Figure 10: Levelized Cost of Energy High End
Based upon the Lazard Report version 8.0 in 2014 alternative energy is becoming competitive from a purely cost analysis of the technologies. The trends in cost reduction in alternative energy sources shows a promising future for alternative energy sources.
Energy Efficiency in Buildings and Transmission and Distribution
Jacobson et al. claims in section 13.3 that the current target for energy efficiency is 15% less energy use below forecasted levels by 2015. Given that it is already 2015 the electricity group looked into current and proposed plans for energy efficiency in buildings and electrical transmission and distribution.
Transmission and Distribution Energy Efficiency
The current New York State Transmission grid supports transmission of high voltage Alternating Current (AC) as shown in the following map.

Figure 11: Transmission Grind for
National Electrical Manufacturers Association (NEMA)
Energy efficiency and usage reduction up to 20% can be accomplished by 2020 according to the Department of Energy through a variety of techniques that have been found by the National Electrical Manufacturers Association (NEMA) (Source). For transmission some of these technologies are as follows:
- High Voltage Direct Current Transmission (HVDC): HVDC has 25% lower line losses, two to five times the capacity of an AC line at similar voltage, plus the ability to precisely control the flow of power.
- Flexible AC Transmission Systems (FACTS): FACTS devices are capable of enhancing current energy by 20-40% by stabilizing voltage and making the transmission more reliable.
- Wide Area Monitoring Systems: Greater monitoring ability by transmission and distribution companies will allow such companies to more closely monitor real time conditions of the lines including thermal monitoring for sagging lines to prevent shorts and to balance loading.
These are just a few of the techniques listed in the NEMA document that includes other possible innovations.
Energy Star
The Energy Star standards under the EPA show many examples of how to improve energy efficiency in homes (Source). Some of these include:
- Geothermal heat pumps
- More efficient furnaces
- Programmable Thermostats
- Sealing heating and cooling ducts
The Energy Star website has many more ways to make homes more energy efficient along with ways to improve building and plant efficiencies as well (Source).
Jacobson et al. claim of 15% energy efficiency by 2015 is not feasible since it is already 2015 but looking at the innovations in place today and the support by the Energy Star programs and websites and other organizations like NEMA there are clearly many ways for New York State to become more energy efficient in their homes, buildings, plants, and transmission and distribution of electricity.