
See index to all the chapters for Putting Out the Planetary Fire
– What is Climate Change?
– The United States has been the principal culprit of Greenhouse gas emissions
– Sources of Fossil Fuel Emissions Globally
– Major Sources of Greenhouse Gas emissions in the US
– We Need to keep Global Warming below 1.5 degrees
– We are not doing well in meeting the 1.5-degree target
– How Fast to Zero emissions, 100% Renewable Energy is Possible?
– How much will the Renewable Energy Transition Cost?
– Why is the number 350 so important?
– Climate Change Drives Extreme Weather
– Climate change hastens the global spread of disease
– Human Extinction is the Worst-case scenario
– Curbing Climate Change Starts with Stopping the Burning of Fossil Fuels
– Fossil Fuel Industry is Impeding Action on climate change
“Climate change” refers to long-term shifts in temperatures and weather patterns. It is also called global warming, the ongoing increase in global average temperature. “Anthropogenic climate change” is climate change caused by human activities.[1]
“Global atmospheric concentrations of carbon dioxide, methane and nitrous oxide have increased markedly as a result of human activities since 1750 … The global increases in carbon dioxide concentration are due primarily to fossil fuel use and land use change, while those of methane and nitrous oxide are primarily due to agriculture.”[2]
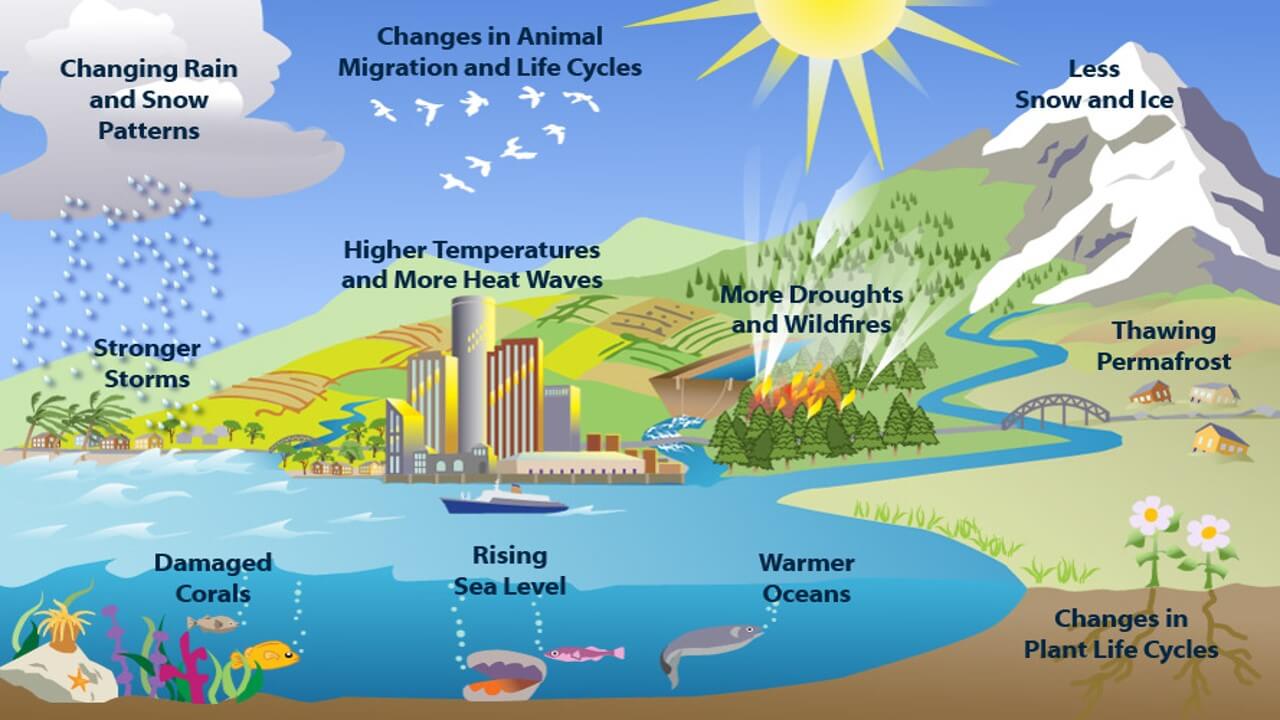 The United Nations notes that “since the 1800s, human activities have been the main driver of climate change, primarily due to burning fossil fuels like coal, oil, and gas…. Greenhouse gas emissions act like a blanket wrapped around the Earth, trapping the sun’s heat, and raising temperatures…. Examples of greenhouse gas emissions that are causing climate change include carbon dioxide and methane. These come from using gasoline for driving a car or coal for heating a building, for example. Clearing land and forests can also release carbon dioxide. Landfills for garbage are a major source of methane emissions. Energy, industry, transport, buildings, agriculture, and land use are among the main emitters.”[3]
The Intergovernmental Panel on Climate Change (IPCC) is the United Nations body for assessing the science related to climate change. The IPCC prepares comprehensive Assessment Reports about the state of scientific, technical, and socio-economic knowledge on climate change, its impacts and future risks, and options for reducing the rate at which climate change is taking place.
In 2019 the IPCC reported that levels of carbon dioxide in the atmosphere were higher than at any time in at least two million years. The Earth’s average surface temperature has increased faster since 1970 than in any other 50-year period over at least the last 2,000 years. Between 2011 and 2020, the annual average area of sea ice coverage in the Arctic reached its lowest level since at least 1850. And the global average sea level has risen faster since 1900 than over any preceding century in at least the last 3,000 years.
Other key findings from the IPCC are:
“It is unequivocal that human influence has warmed the atmosphere, ocean, and land. Widespread and rapid changes in the atmosphere, ocean, cryosphere, and biosphere have occurred.”
“Continued global warming is projected to further intensify the global water cycle, including its variability, global monsoon precipitation and the severity of wet and dry events.”
“Many changes due to past and future greenhouse gas emissions are irreversible for centuries to millennia, especially changes in the ocean, ice sheets and global sea level.”[4]
Methane is 80 times more potent short-term (20 years) as a greenhouse gas compared to carbon.[5] Leaks from natural gas pipelines are a major source of methane. Many have promoted natural gas as a bridge fuel to a clean energy future, and until recently, the problems with methane have been downplayed. It is now clear that, rather than a bridge, natural gas is a gangplank to a climate disaster.[6]
The United States has been the Principal Culprit of Greenhouse Gas Emissions
While China has surpassed the U.S. as the largest annual emitter of greenhouse gases, the U.S. still is the leader in terms of cumulative emissions.[7]
The United States has been burning coal, oil, and natural gas far longer than China. As of 2017, the U.S., with just over 4 percent of the world’s population, was responsible for almost a third of the excess carbon dioxide in the atmosphere. China was responsible for less than a sixth. The 28 countries of the European Union cumulatively came in just behind the United States.[8]
We in the U.S. still emit the most carbon dioxide per capita among the industrial nations, at 14.2 metric tons, but those emissions have been dropping since the early 1970s. China emitted 7.4 metric tons per capita in 2020, higher than the European Union at 5.8 metric tons but lower that Japan’s 8.1 metric tons. Russia had 10.8 metric tons of carbon dioxide emissions per capita.[9]
A 2022 study by the Center for Global Development found that “developing” countries were responsible for 63% of yearly carbon emissions. Increased carbon emissions were particularly attributable to economic growth in the developing countries of Asia. China and India are both classified as developing countries, as well as South Korea.[10]
Sources of Global Greenhouse Gas emissions
(billion tons of CO2e[11]; 2018 figures)[12]
Burning Fossil Fuels 40 billion tons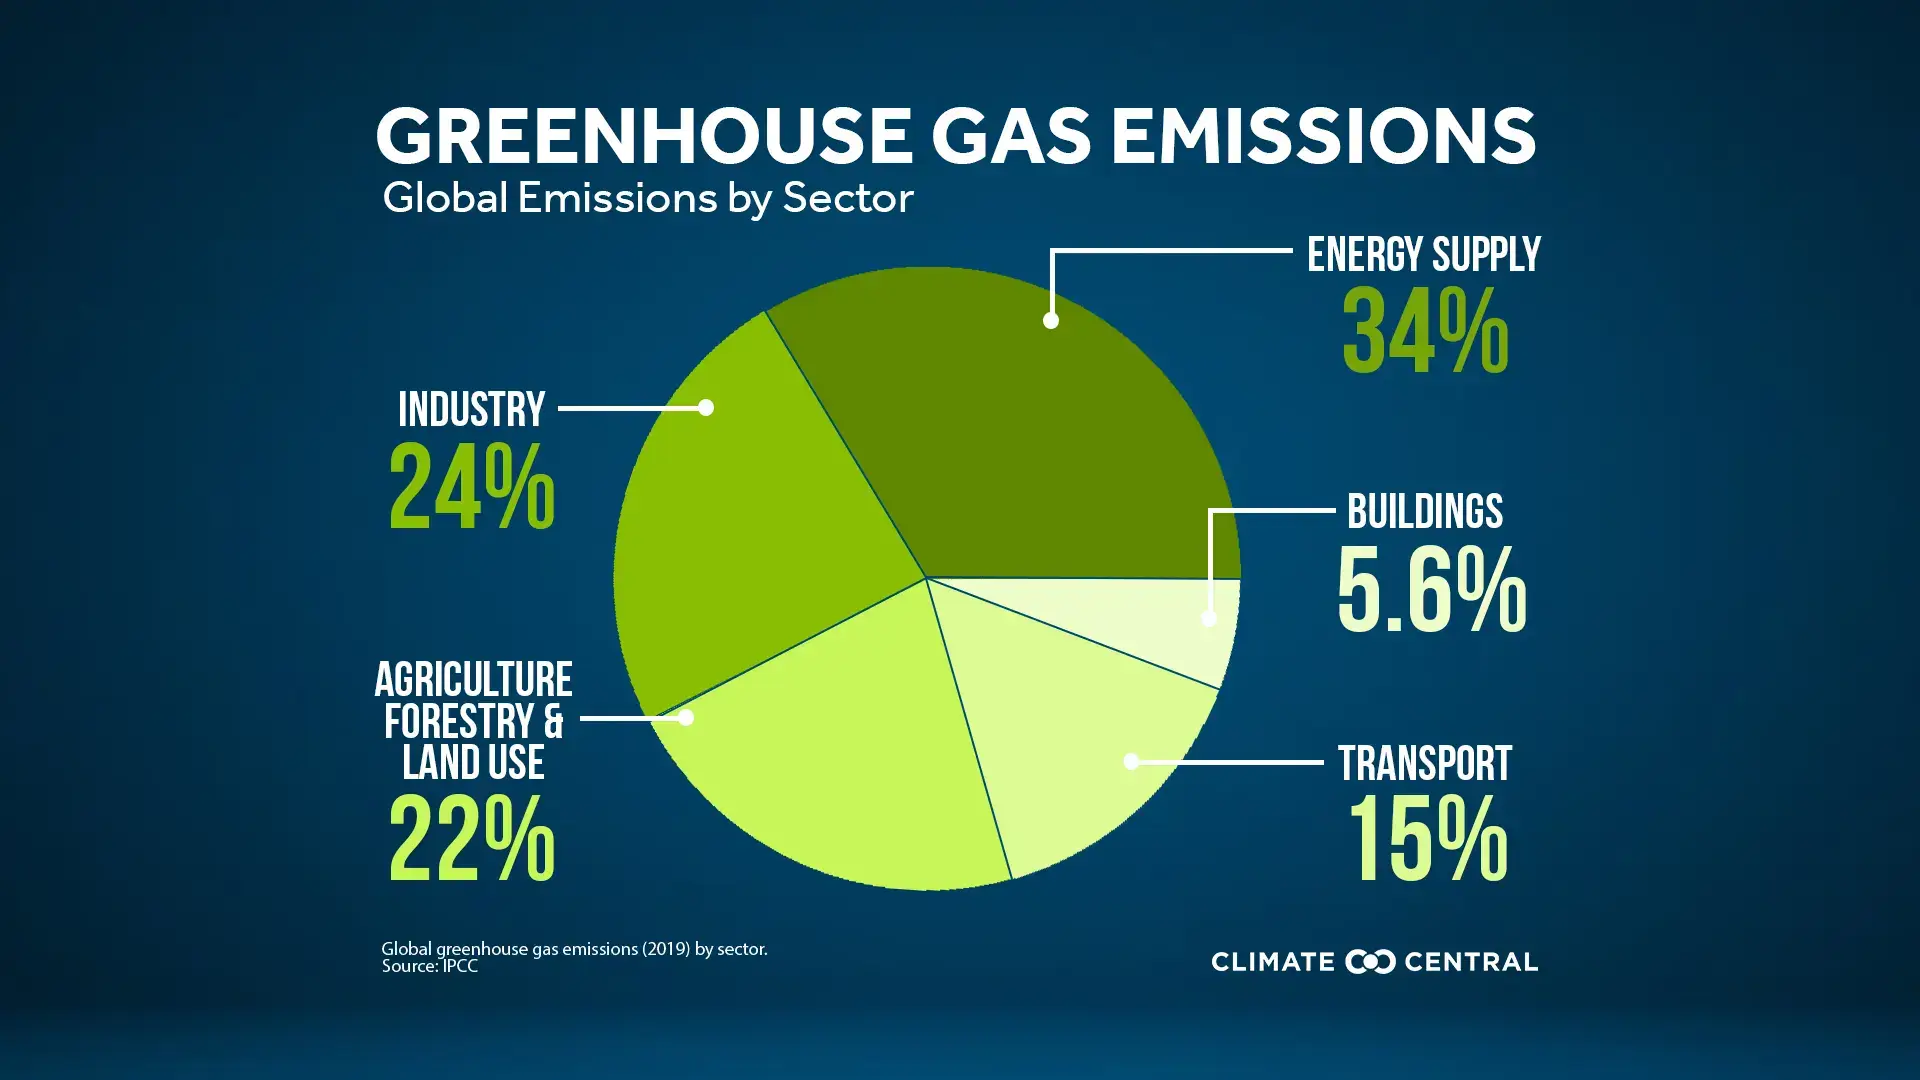
Manufacturing electricity 15
Transport 10
Heating industrial materials 5
Natural gas leaks 4
Industrial byproducts 3
Heating buildings 3
Agriculture 7 billion tons
Cattle and sheep 3
Fertilizers 3
Rice 1
Other 8 billion tons
Deforestation 5
Landfills and Sewage 1.5
F-gases 1.5
TOTAL 58 billion tons
Carbon Footprint by Country 2022[14]
Top 10 CO2-emitting countries in the world (metric tons) 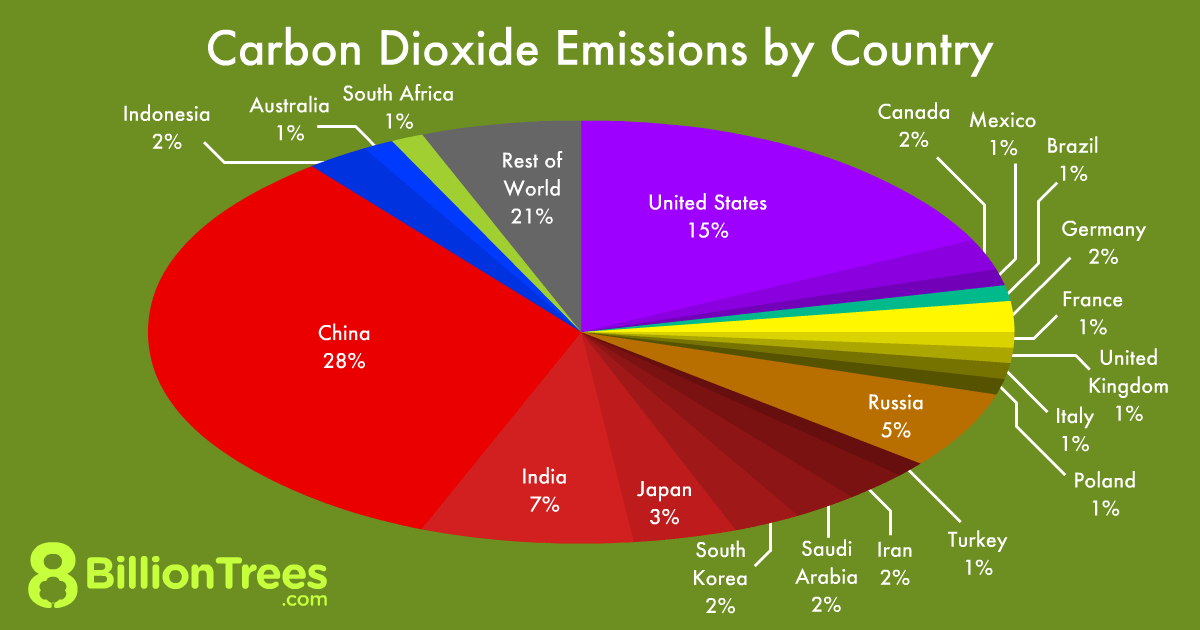
China …………………… 11,680.42
United States ………….. 4,535.30
India ………………………. 2,411.73
Russia ……………………. 1,674.23
Japan ……………………… 1,061.77
Iran ………………………….. 690.24
Germany …………………… 636.88
South Korea ………………. 621.47
Saudi Arabia ……………… 588.81
Indonesia ………………….. 568.27
Top 15 Countries with the Highest CO2 Emissions per Capita
(metric tons)
Palau ………………………….. 55.29
Qatar ………………………….. 35.64
Trinidad and Tobago ……. 21.97
Bahrain ………………………. 21.60
Kuwait ……………………….. 20.91
United Arab Emirates …… 20.70
Brunei Darussalam ………. 17.95
Saudi Arabia ……………….. 16.96
Oman …………………………. 16.9
Australia …………………….. 15.22
Canada ……………………….. 14.43
Kazakhstan …………………. 14.22
United States ………………. 13.68
Turkmenistan ………………. 13.37
Luxembourg ……………….. 13.24
Countries With Highest Use of Renewable Energy
Here are the places with the highest shares of primary energy from renewable sources as of 2019, along with the change in this amount in percentage points since 1965.[15]
Iceland………………………… 79.08% (+55.25)
Norway……………………….. 66.18% (-0.32)
Brazil………………………….. 45.02% (+18.70)
Sweden……………………….. 42.24% (+8.70)
New Zealand……………….. 35.40% (-2.48)
Austria………………………… 33.70% (+9.76)
Switzerland…………………. 30.64% (-6.93)
Ecuador………………………. 30.39% (+22.36)
Denmark……………………… 30.16% (+30.12)
Canada………………………… 27.64% (+3.66)
(#42) United States………… 8.71% (+4.66)
Environment America maintains a chart showing progress in each state in the U.S. in developing renewable electricity.[16]
Major Sources of Greenhouse Gas Emissions in the U.S.
Much of the public discussion around creating a clean energy future focuses on the electricity sector. However, the production of electricity is a relatively small source of greenhouse gas emissions. The mix of emission sources varies from state to state and from nation to nation. For instance, in New York State, buildings account for 32% of emissions, transportation 28%, and electricity 13%.[17] Here is an overview from the federal EPA of greenhouse gas emissions in the U.S.[18]:
Transportation (27% of 2020 greenhouse gas (GHG) emissions) – Transportation accounts for the largest share of greenhouse gas emissions. Emissions primarily come from burning fossil fuel for our cars, trucks, ships, trains, and planes. Over 90% of the fuel used for transportation is petroleum based, which includes primarily gasoline and diesel.
Electricity production (25% of 2020 GHG emissions) – Electric power is the second largest share of greenhouse gas emissions. Approximately 60% of our electricity comes from burning fossil fuels, mostly coal and natural gas.
Industry (24% of 2020 GHG emissions) – Industrial emissions primarily come from burning fossil fuels for energy, as well as greenhouse gas emissions from certain chemical reactions necessary to produce goods from raw materials.
Commercial and residential buildings (13% of 2020 GHG emissions) – Emissions from businesses and homes arise primarily from fossil fuels burned for heat, the use of certain products that contain greenhouse gases, and the handling of waste.
Agriculture (11% of 2020 GHG emissions) – Emissions from agriculture come from livestock such as cows, agricultural soils, and rice production.
Land use and forestry (13% of 2020 GHG emissions) – Land areas can act as a sink (absorbing CO2 from the atmosphere) or a source of GHG emissions. In the U.S. since 1990, managed forests and other lands are a net sink.
Electricity production is the easiest to move to 100% renewable energy. The general goal is to reduce energy use as much as possible and then electrify everything that remains. A challenge is that some industrial processes, particularly cement making, require high temperatures that have proven difficult to commercially generate without burning fossil fuels. Cement alone accounts for 8% of worldwide CO2 emissions.[19] This is a major reason why governments have tended to set long term emission goals (by 2050) as net zero rather than real zero.
We Need to Keep Global Warming Below 1.5 Degrees
Lowering the target for global warming to try to keep it to 1.5 degrees Celsius was the big win for the developing world against the U.S. and other industrial nations at the 2015 Paris Climate Summit that sought to keep a 2-degree goal. The final agreement was to keep warming “well below 2 degrees” while also agreeing to “aim to limit the increase to 1.5 degrees C, since this would significantly reduce risks and the impacts of climate change.”[20] Since Paris 1.5 degrees has increasingly become the target.
1.5° C of warming will still expose millions of people to more extreme climates, rising sea levels, and more frequent weather-related disasters including heatwaves, drought, flooding, and wildfires. Additional increases in average temperature will make their severity and frequency worse. The negative impacts from global warming are hitting the world’s poorest and most vulnerable communities hardest, partially because they tend to be closer to the equator where the temperature rise will be greater.
“With an average temperature rise of more than 1.5° C, all climate impacts become more severe, including extreme temperature, droughts, water and food scarcity, and biodiversity loss. This is partly due to ‘tipping points’ – where climate change causes damage to the natural systems that help to stabilize temperatures, resulting in accelerated warming. If the average global temperature were to rise by 2° C, for example, the IPCC has predicted that 37 per cent of the world’s population would be exposed to at least one deadly extreme-heat event every five years, compared to 14 per cent in a 1.5° C scenario. That’s an extra 1.7 billion people affected with just half a degree of further warming. This is just one illustration of why every decimal point matters in the fight to stay within 1.5° C.”[21]
“With a 1.5° C rise, about 4% of Earth’s terrestrial land area is projected to undergo a transformation of ecosystems from one type to another. With a 2° C global temperature rise, about 13% is projected to undergo a shift. With a 2° C increase, compared with a 1.5° C increase, the number of heat-related deaths and the number of people infected with vector-borne diseases such as malaria and dengue fever are projected to increase.”[22]
It’s difficult to predict what our world will look like with 2.5° C or more of warming, but large areas could become uninhabitable for humans.
Some scientists have also raised warnings about a possible “hothouse effect.” “Self-reinforcing feedbacks could push the Earth System toward a planetary threshold that, if crossed, could prevent stabilization of the climate at intermediate temperature rises and cause continued warming on a ‘Hothouse Earth’ pathway even as human emissions are reduced. Crossing the threshold would lead to a much higher global average temperature than any interglacial in the past 1.2 million years and to sea levels significantly higher than at any time in the Holocene.”[23]
Those in the developing world will be the principal victims of climate change that has largely been caused by the Global North. Climate reparations by the industrial polluters are needed to pay for the damage we are causing.[24] In addition, action must be taken to enable developing countries to raise their people’s standard of living now that the path of burning fossil fuels to drive one’s economy is foreclosed to them. How do they catch up? (See chapter on reparations.)
We are Not Doing a Good Job of Meeting the 1.5-Degree Target
Average global temperatures are now between 1.1-1.2° C higher than pre-industrial. Eight of the 10 warmest years on our planet occurred in the last decade.[25] The UN weather agency has warned that it is increasingly likely that the annual average global temperature will rise beyond 1.5° C above pre-industrial levels in at least one of the next five years.[26] Other bodies such as the World Meteorological Organization have said that the odds of exceeding the limit short term are quite a bit higher.
In October 2022, the IPCC said to stay within the 1.5 C limit, total GHG emissions need to fall 43% by 2030, compared with 2019 levels. However, based on existing government pledges, the world is headed toward a 10.6% increase in annual emissions by 2030 over 2010 levels, with a temperate rise of 2.5° C (4.5° F). According to a report released in November 2022 by the Global Carbon Project, emissions from fossil fuels in 2022 are expected to reach 37.5 billion tons of carbon dioxide, the highest ever recorded.[27]
Deadly heat waves, droughts, wildfires, tropical cyclones, severe flooding events, and other disasters have become more common. “In 2019, storms, floods and other extreme weather events displaced more than 13 million people across Asia and Africa. Rising heat and drought are killing crops and trees, putting millions worldwide at increased risk of hunger and malnutrition, while mosquitoes carrying diseases like malaria and dengue are spreading into new areas. Roughly half the world’s population currently faces severe water scarcity at least part of the year.”[28]
The American Meteorological Society’s most recent state of the climate report found the atmospheric concentration of heat-trapping carbon dioxide grew at the fifth-fastest rate on record in 2021 to reach its highest point in 800,000 years.[29]
Other scientists find the IPCC overly optimistic with reduction targets that are too slow to keep global warming in check.
A recent study published in the journal Science finds that even the most aggressive goals of reducing greenhouse gas emissions won’t be sufficient to avoid several major climate change tipping points (like the melting of the permafrost, collapse of ice shelves), in which rising temperatures cause irreversible damages that in turn cause more global warming.[30]
How Fast Can We Get to Zero Emissions, 100% Renewable Energy?
Scientists differ widely in their estimations as to how fast we can move to 100% renewable energy and zero emissions. Many point out that the biggest obstacles are political, not technological.[31]
I have always argued that we need to focus on how fast we have to cut emissions to avoid climate collapse. Once that date is set, we then need to devote the necessary resources to achieving it, even though it might presently seem impractical. After all, we are facing a climate crisis that poses an existential threat to the future of life on the planet.
It is generally agreed that the last 10 to 15% of emissions will be the hardest to eliminate, and therefore we should focus on a much faster timeline for the initial 80% to 90% reduction in emissions.
One issue is whether it is even possible to get to zero emissions since some industrial processes such as cement and aluminum manufacturing require temperatures higher than thought feasible from renewable electricity (though some recent experiments suggest otherwise[32]). Thus, in recent years the term “net zero emissions” has become more common, with some limited use of fossil fuels being offset by ways of removing carbon from the atmosphere.[33]
The IPCC, the groups of scientists convened by the United Nations to guide them on climate science, is considered the gold standard on such issues. In October 2022, the IPCC said that to stay within the 1.5° C warming threshold, greenhouse gas emissions must peak by 2025, reduce by 45% by 2030, and reach net zero by 2050. However, the IPCC acknowledges that such emission cuts will not be adequate to keep global warming below 1.5°. Thus, the IPCC also calls for significant carbon removal from the atmosphere.[34] Unfortunately, decades of research and tens of billions of dollars invested have failed to show that carbon capture technologies are feasible (see chapter on false climate solutions.)
On September 23, 2019, Swedish climate activist Greta Thunberg in her speech at the UN criticized the IPCC for its GHG emissions-reduction goals: “The popular idea of cutting our emissions in half in 10 years only gives us a 50% chance of staying below 1.5 degrees [Celsius], and the risk of setting off irreversible chain reactions beyond human control. Fifty percent may be acceptable to you. But those numbers do not include tipping points, most feedback loops, additional warming hidden by toxic air pollution or the aspects of equity and climate justice. They also rely on my generation sucking hundreds of billions of tons of your CO2 out of the air with technologies that barely exist. So, a 50% risk is simply not acceptable to us — we who have to live with the consequences.”[35]
The IPCC’s 6th Assessment Report released on March 20, 2023, once again stressed that the world’s governments are not acting fast enough to cut emissions, with the global warming target of 1.5 degrees C likely be exceeded within the next decade. Other scientists, however, raised concerns that fossil fuel interests and their government supporters had once again watered down the “science” and the seriousness of the problem. Several nations lobbied to weaken or remove references to the environmental costs of burning fossil fuels and consuming meat, as well as adding language that bolsters support for controversial carbon capture technology while understating the benefits of renewable energy.[36]
The IPPC report did send the clearest message to date, that because of the slow response in cutting emissions, it’s time to prioritize adaptation to a world being transformed by climate change and in a way that do ways that do not exacerbate already deep inequalities.[37]
The leading scientist documenting the feasibility of a fast transition to 100% clean renewable energy is Professor Mark Jacobson of Stanford University. I highly recommend his book No Miracles Needed: How Today’s Technology Can Save Our Climate and Clean Our Air.[38] It lays out in detail the various steps how the world can transition to 100% clean renewable wind, water, and solar (WWS) and storage for all energy purposes.
In 2009, Prof. Jacobson co-authored a report saying that the world could meet zero greenhouse gas emissions by 2030. He and several Cornell professors put out a similar 2030 timeline study for New York during the fight to halt fracking for gas. Since then, he has written many studies for individual countries, though he often now uses 2050 as his “final” target date.[39] (Prof. Jacobson does have a fair number of critics, and his studies are more about plugging official government data into his spreadsheets than a detailed analysis of the steps needed, with timelines, actions, etc.[40])
When I asked Prof. Jacobson in 2015 – when I was drafting legislation intended to move New York to 100% renewable energy – as to what was the proper timeline, he said he has always been clear than 2030 is technologically feasible but that he adds 20 years to give politicians and business leaders “wiggle room.” Since politicians always add wiggle room anyway, we wrote our bill with a 2030 timeline.
Jacobson’s August 2022 study outlines how 145 countries (representing 99.7% of world fossil fuel use) could meet 100% of their business-as-usual energy needs with wind, water, solar and energy storage. While the upfront cost would be $73 trillion, the costs would be recovered within 6 years through reduced health care and other costs associated with climate change. The timetable is “ideally by 2035, but by no later than 2050, with at least 80% by 2030.” He estimated that such a transition would create 28 million more jobs than it would eliminate.[41]
A British think tank in 2016 said that fossil fuels could be eliminated worldwide within a decade.[42]
A study by the University of California at Berkeley concluded we could get to 90% zero-carbon power by 2035 with wind, solar, hydropower and nuclear power – at no extra cost to consumers.[43]
In November 2022 the Department of Energy outlined “four major viable paths [for the U.S.] to a net zero emissions ‘clean electricity’ power system by 2035 in which benefits exceed costs.” The net zero target meant a 90% reduction in emissions.[44] A similar study by the Union of Concerned Scientists found that that the 24 states in the Climate Alliance can meet 100% of their electricity consumption with renewable energy by 2035, even with the strong increases in demand that would come from the electrification of transportation and heating.[45]
Some climate scientists have also stressed that in order to meet the IPCC’s goal of a 50% chance of keeping global warming below the 1.5° C target, the wealthy industrial developed countries must cut emissions faster than the developing world. A study by the Tyndall Centre for Climate Change Research said that the wealthiest countries need to phase out their domestic production of fossil fuels by 2034 and provide significant finance to developing countries, which would have a 2050 goal.[46]
How Much will the Renewable Energy Transition Cost?
While it will cost a lot of money to transition to a clean energy future, it will be a lot less than the increased costs associated with climate change and extreme weather if we fail to act.
The estimates of the transition costs vary widely, in part because the various researchers take different approaches to their calculations. A major issue is the significant amount of money the world is already spending to provide energy and how much of those expenditures can pay for the clean energy transition. And the cost of renewable energy has fallen much faster than was predicted.[47]
Converting the entire U.S. power grid to 100% renewable energy in the next decade would cost an estimated $4.5 trillion, according to the energy research firm Wood Mackenzie. This represents the cost of replacing all fossil fuels and nuclear power with hydroelectricity, biomass, geothermal, wind, and solar. The price tag would be $4 trillion if nuclear were continued.[48]
A 2022 report by New York State (partly at my request) as part of its recent climate scoping plan estimated that the cost to transition the entire economy to net zero emissions by 2050 would be $3 trillion. However, they assumed that 90% of the costs would come from existing expenditures for energy, leaving $300 billion to be raised over 30 years. The additional costs would be offset by the $400 to $420 billion in benefits from “avoiding economic impacts of damages caused by climate change and the improvements in public health.”[49]
As noted above, Jacobson estimates that a global effort to transition to 100% renewable energy by 2050 would cost $73 trillion upfront, including $7.8 trillion for the U.S. — but the expense will pay for itself in under seven years.[50]
The International Energy Agency estimates that to get to net zero emission (NZE) by 2050 would require “expanding annual investment in energy from just over USD 2 trillion globally on average over the last five years to almost USD 5 trillion by 2030 and to USD 4.5 trillion by 2050. Total annual capital investment in energy in the NZE (rises from around 2.5% of global GDP in recent years to about 4.5% in 2030 before falling back to 2.5% by 2050.”[51]
The IEA noted that “most of this increase in investment comes from private sources, mobilized by public policies that create incentives, set appropriate regulatory frameworks and reform energy taxes. However, direct government financing is also needed to boost the development of new infrastructure projects and to accelerate innovation in technologies…. The large increase in capital investment in the NZE is partly compensated for by lower operating expenditures. The clean technologies that play an increasing role in the NZE are characterized by much lower operating costs.”[52]
Why is the Number “350” so Important?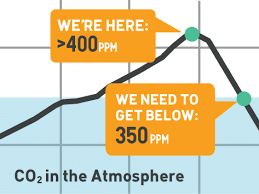
350.org, founded in 2008 by author Bill McKibben and students such as May Boeve at Middlebury College in Vermont, has been one of the most important groups mobilizing the public worldwide to demand action on climate. They are perhaps best known for launching the campaign to divest college, religious and public pension funds from fossil fuels, and being one of the lead organizers of the 400,000 People’s Climate March in NYC in 2014.[53] And their name is taken from the maximum “safe” concentration of carbon dioxide in the atmosphere – 350 parts per million.
As humanity evolved over the past several hundred thousand years, atmospheric CO2 levels ranged between 200 and 300 ppm. The preindustrial level of CO2 before the Industrial Revolution was about 280 ppm.[54]
Atmospheric concentrations of CO2 must be reduced from current levels of around 420 ppm to at most 350 ppm to avoid dangerous climate change and provide a good chance of limiting future warming to 1.5° C.[55] Unfortunately, that number has steadily increased since 350.org was founded. It hit 415 ppm in 2021.[56]
Climate Change Drives Extreme Weather[57]
Extreme weather events that were once rare occurrences are now increasingly commonplace. 100-year weather events may happen every 5 to ten years; 1,000-year events may occur every few decades. While we cannot pinpoint climate change as a cause of any particular extreme weather event, it has been shown to make extreme events more frequent, and more destructive.[58]
Global warming is swinging the pendulum out wider on the weather we experience, while making it more intense. Heat provides more energy to storms, so hurricanes warmed by the ocean waters grow to categories 3, 4 and 5 rather than staying at category 1 levels. As regions such as California and Australia grow hotter and drier, wildfires are growing in size, ferocity, and speed. Heat waves are growing in frequency, intensity, and length.
Warmer air increases evaporation, putting more water vapor into the air for storms to sweep up and turn into rain or snow. In upstate New York where I live, it is expected that while the amount of rainfall will remain relatively the same, rainstorms will be less frequent but more intense. Our environment – plants, soil – are not adapted to absorbing 2 inches of rainfall at a time, so we can expect more erosion and flooding which will harm our food supply. While winters overall are getting milder, individual storms are getting more intense both from stronger winds and increased water vapor leading to heavier snowfall.
The number of weather events causing more than $1 billion in damages is increasing. In 2021, National Oceanic and Atmospheric Administration reported that wildfires, hurricanes, tornadoes and a winter storm and cold wave were among 20 weather and climate disasters that cost $1 billion or more in the U.S., totaling $145 billion and killing 688 people.[59]
Climate Change Hastens the Global Spread of Diseases
A major problem with human driven climate change is that it is occurring much faster than changes driven by nature – faster than species including humans can adapt and evolve. There are limits to how fast trees and plants can move (shift) to respond to changing temperatures.
Insects that cause diseases in humans, animals, trees, and plants can rapidly move to thrive in new biospheres with higher temperature,[60] faster often that their natural predators that keep them in check are able to move. Insect biology, climate quirks, and public health preparedness will influence whether outbreaks occur. The spread of Lyme disease and malaria are examples of this.[61]
Human Extinction is the Worst-Case Scenario
While human extinction is a slight possibility, scientists in an August 2022 study warned that the risk of global societal collapse or human extinction has been “dangerously underexplored. Facing a future of accelerating climate change while blind to worst-case scenarios is naïve risk management at best and fatally foolish at worst.” The authors stated that there are “ample reasons” to suspect global heating could result in an apocalyptic disaster and called for the world to start preparing for the possibility, starting with the IPCC issuing a special report. Climate breakdown could trigger other catastrophic risks, such as international wars or infectious disease pandemics, and worsen existing vulnerabilities such as poverty, crop failures and lack of water. The IPCC should especially examine famine, extreme weather, war, and disease.[62]
Since the turn of the century, global deaths attributed to air pollution have increased by more than half. Air pollution was responsible for an estimated 9 million deaths around the world in 2019. 4.5 million deaths were the result of outdoor air pollution, emitted by vehicles and industrial sources like power plants and factories. Poorer countries bear a disproportionate share of the impacts of pollution deaths.[63]
Curbing Climate Change Starts with Stopping the Burning of Fossil Fuels
While the world needs to rapidly transition to a clean energy future – wind, solar, battery storage, conservation, regenerative agriculture – the single most important step is to cut greenhouse gas emissions, getting to real zero as soon as possible. While this may seem an obvious point, it often is pushed to the side by governments. which then can find that emissions fail to decline as much as expected even as the percentage of renewable energy significantly increases. Germany is perhaps the best-known example.[64]
The Fossil Fuel Industry is Impeding action on Climate Change:
Money Talks in Politics.
According to one study, the oil and gas industry made an estimated $2.8 billion a day in pure profit for the last 50 years. That vast wealth “is providing the power to ‘buy every politician, every system’ and delay action on the climate crisis.”[65]
A campaign contribution has long been the best investment that Wall Street can make. For every dollar the fossil fuel industry contributes to American politicians, they receive $119 in federal exploration and production subsidies.[66]
Donald Trump was the largest recipient of campaign donations from the oil and gas industry in the 2020 presidential election, receiving $3.8 million. Of the top five beneficiaries, only one was a Democrat – presidential candidate Joseph Biden. In total, fossil fuel contributions to the GOP were $63.6 million during that election cycle.[67] Researchers have found a correlation between an increase in anti-environment votes and an increase in contributions.[68]
In the closest federal races in the 2022 mid-term elections, “the oil and gas industry [ ] spent an estimated average of $4.3 million per Senate seat and $490,000 per House seat through direct contributions, funding for party committees, and funding for super PACs. Twenty oil & gas companies and industry trade associations contributed more than $52 million to right-wing super PACs and party fundraising committees, and more than $4 million to candidate PACs.” (These numbers will increase once post-election campaign filings are made.)[69]
During the 2017-2018 midterm election cycle, corporations, individuals, and trade groups in the fossil fuel industry spent $265,773,915 in lobbying and $93,392,002 in contributions to national-level candidates, parties, and outside groups, bringing the total spending to $360 million in two years. That’s $500,000 per day. During the same period, renewable energy companies spent $26 million. For every dollar spent on behalf of wind, solar, or hydroelectric energy interests, $13.70 was spent by fossil fuel interests.[70]
In addition to campaign contributions, there is a revolving door between the fossil fuel companies, the regulatory agencies, and elected offices, as individuals move back and forth between the private and public sector.[71] Be a friend to the fossil fuel industry as a regulator or elected official and there will be a high paying job as a consultant or lobbyist waiting for you on departure. Many “monetize” their time as public servants.
While scientists have sounded the alarm for decades, the fossil fuel industry mounted an aggressive disinformation campaign casting doubt about the science of climate change and played into the American media’s propensity for on-the-one-hand/on-the-other-hand reporting. So, while the overwhelming scientific consensus was that the burning fossil fuels was driving climate change, the American media tended to give 50% of the airtime to the “less than 1 percent who profess to be skeptics.”[72]
ExxonKnews has documented that “Scientists and executives at fossil fuel companies such as Exxon knew since as early as 1968 that burning fossil fuels would raise global temperatures, which could lead to ‘catastrophic’ consequences.”[73]
The Union of Concerned Scientists point out the executives at fossil fuel companies “chose to downplay and distort the evidence of climate change, engaging in a decades-long campaign against climate action. Their tactics included everything from counterfeit science, to the harassment of scientists, to manufactured uncertainty with no scientific basis. Even today, industry trade groups and associations spread disinformation on climate change, while corporate lobbyists influence politicians and regulators—all with the financial backing and support of major fossil fuel companies.”[74]
Such deceptions have prompted a wave of lawsuits in the last decade against fossil fuel companies. A 50-page brief filed in the 2020 lawsuit by the District of Columbia details academic studies and media reports to show how the oil industry was warned about the risks from burning fossil fuels beginning in the late 1950s. One example was an October 1989 Shell report warning that “climate-fueled migration could swamp borders in the United States, Soviet Union, Europe, and Australia.”[75]
[1] https://geo.libretexts.org/Bookshelves/Geology/Book%3A_An_Introduction_
to_Geology_(Johnson_Affolter_Inkenbrandt_and_Mosher)/
[2] https://archive.ipcc.ch/publications_and_data/ar4/wg1/en/spmsspm-human-and.html
[3] https://www.un.org/en/climatechange/what-is-climate-change
[4] https://www.nrdc.org/stories/ipcc-weve-already-warmed-planet-catastrophic-effect-level-catastrophe-us
[5] https://unece.org/challenge
[6] https://www.nytimes.com/2013/07/29/opinion/gangplank-to-a-warm-future.html
[7] https://world101.cfr.org/global-era-issues/climate-change/who-releases-most-greenhouse-gases
[8] https://www.nytimes.com/interactive/2017/06/01/climate/us-biggest-carbon-polluter-in-history-will-it-walk-away-from-the-paris-climate-deal.html
[9] https://www.instituteforenergyresearch.org/international-issues/chinas-carbon-dioxide-emissions-more-than-twice-those-of-the-u-s
[10] https://www.cgdev.org/media/developing-countries-are-responsible-63-percent-current-carbon-emissions; https://phys.org/news/2022-11-corruption-fuels-carbon-dioxide-emissions.html
[11] Carbon dioxide equivalent or CO2e means the number of metric tons of CO2 emissions with the same global warming potential as one metric ton of another greenhouse gas. EPA Carbon Footprint Calculator Tool, available at https://www3.epa.gov/carbon-footprint-calculator/tool/definitions/co2e.html
[12] Fight the Fire, https://theecologist.org/sites/default/files/2021-02/Fight_the_Fire_0.pdf, p. 38
[13] Fluorinated gases, developed to replace freon and other substances that can damage Earth’s ozone layer, are themselves powerful greenhouse gases, with an even higher warming potential than CO2.
[14] https://worldpopulationreview.com/country-rankings/carbon-footprint-by-country
[15] https://solarpower.guide/solar-energy-insights/countries-largest-shares-renewable-energy-solar
[16] https://environmentamerica.org/resources/renewables-on-the-rise-dashboard/
https://environmentamerica.org/resources/states-and-cities-going-renewable/
[17] Table ES.3, https://www.dec.ny.gov/docs/administration_pdf/ghgsumrpt21.pdf
[18] https://www.epa.gov/ghgemissions/sources-greenhouse-gas-emissions
[19] https://www.pbs.org/newshour/show/can-concrete-a-major-co2-emitter-be-made-greener
[20] https://www.dw.com/en/ipcc-tackles-15-degree-celsius-climate-target/a-19475794
[21] https://www.tearfund.org/stories/2021/10/why-1-5-degrees-the-crucial-climate-target-explained; https://yaleclimateconnections.org/2021/08/1-5-or-2-degrees-celsius-of-additional-global-warming-does-it-make-a-difference/
[22] https://yaleclimateconnections.org/2021/08/1-5-or-2-degrees-celsius-of-additional-global-warming-does-it-make-a-difference/
[23] https://theconversation.com/hothouse-earth-heres-what-the-science-actually-does-and-doesnt-say-101341; https://www.pnas.org/doi/10.1073/pnas.1810141115
[24]https://yaleclimateconnections.org/2021/08/1-5-or-2-degrees-celsius-of-additional-global-warming-does-it-make-a-difference/
[25] https://www.nhm.ac.uk/discover/news/2022/january/last-eight-years-have-been-the-hottest-on-record.html
[26]https://news.un.org/en/story/2021/05/1092842
[27] https://www.washingtonpost.com/climate-environment/2022/12/05/carbon-emissions-peak-record-2022/ https://gizmodo.com/un-report-climate-change-2-degrees-warming-1849704926; https://www.ipcc.ch/2018/10/08/summary-for-policymakers-of-ipcc-special-report-on-global-warming-of-1-5c-approved-by-governments/;
[28] https://www.nytimes.com/2022/02/28/climate/climate-change-ipcc-report.html
[29] https://www.ametsoc.org/index.cfm/ams/publications/bulletin-of-the-american-meteorological-society-bams/state-of-the-climate/
[30] https://www.science.org/doi/10.1126/science.abn7950
[31] https://en.reset.org/biggest-barriers-renewable-energies-are-political-new-report-states-05232021/
[32] https://cordis.europa.eu/article/id/421794-the-next-solar-revolution-could-power-cement-production-with-sunlight
[33] https://www.un.org/en/climatechange/net-zero-coalition
[34] https://www.ipcc.ch/site/assets/uploads/sites/2/2019/06/SR15_Headline-statements.pdf
[35] https://www.npr.org/2019/09/23/763452863/transcript-greta-thunbergs-speech-at-the-u-n-climate-action-summit
[36] https://insideclimatenews.org/news/28032023/corporate-interests-watered-down-the-latest-ipcc-climate-report-investigations-find/
[37] https://capitalandmain.com/the-world-will-miss-the-climate-change-target-time-to-prepare
[38] No Miracles Needed: How Today’s Technology Can Save Our Climate and Clean Our Air. Cambridge University Press, 2023; audio, https://podglomerate.com/?episode=no-miracles-needed-mark-jacobson-on-how-todays-technology-can-save-our-climate-and-clean-our-air
[39] https://www.scientificamerican.com/article/a-path-to-sustainable-energy-by-2030/; https://web.stanford.edu/group/efmh/jacobson/Articles/I/NewYorkWWSEnPolicy.pdf
[40] https://blogs.scientificamerican.com/plugged-in/landmark-100-percent-renewable-energy-study-flawed-say-21-leading-experts/; https://www.renewableenergyworld.com/wind-power/a-decidedly-impartial-review-of-mark-jacobsons-100-clean-renewable-energy-and-storage-for-everything/
[41] https://www.pv-magazine.com/2022/08/08/study-finds-100-renewables-would-pay-off-within-six-years/; https://www.cell.com/one-earth/fulltext/S2590-3322(19)30225-8#%20
[42] https://phys.org/news/2016-04-fossil-fuels-phased-worldwide-decade.html
[43] https://na.panasonic.com/us/green-living/us-could-shift-90-percent-renewable-energy-2035-no-extra-cost
[44] https://www.utilitydive.com/news/us-can-reach-100-clean-power-by-2035-doe-finds-but-tough-reliability-and/635874/
[45] https://www.ucsusa.org/resources/road-100-percent-renewables
[46] https://research.manchester.ac.uk/en/publications/phaseout-pathways-for-fossil-fuel-production-within-paris-complia
[47] https://www.forbes.com/sites/christinero/2022/09/14/renewable-energy-costs-have-dropped-much-faster-than-expected-but-theres-a-catch/?sh=2a32370d3164
[48] https://e360.yale.edu/digest/shifting-u-s-to-100-percent-renewables-would-cost-4-5-trillion-analysis-finds
[49]https://climate.ny.gov/-/media/project/climate/files/Appendix-G.pdf , p.8
[50] https://e360.yale.edu/digest/the-global-price-tag-for-100-percent-renewable-energy-73-trillion; https://www.cell.com/one-earth/fulltext/S2590-3322(19)30225-8#%20
[51] https://iea.blob.core.windows.net/assets/deebef5d-0c34-4539-9d0c-10b13d840027/NetZeroby2050-ARoadmapfortheGlobalEnergySector_CORR.pdf, p. 81
[52] Ibid, p. 82
[54] https://climate.mit.edu/ask-mit/what-ideal-level-carbon-dioxide-atmosphere-human-life
[55] https://www.biologicaldiversity.org/programs/climate_law_institute/350_or_bust/pdfs/
CLI_350_factsheet.pdf
[56] https://news.un.org/en/story/2022/10/1129887
[57] https://earthjustice.org/features/how-climate-change-is-fueling-extreme-weather
[58] https://education.nationalgeographic.org/resource/influence-climate-change-extreme-environmental-events
[59] https://www.npr.org/2022/01/11/1072077479/extreme-weather-in-u-s-cost-688-lives-and-145-billion-noaa
[60] https://www.fs.usda.gov/ccrc/topics/insect-disturbance-and-climate-change
[61] https://www.pnas.org/doi/10.1073/pnas.2200481119
[62] https://www.theguardian.com/environment/2022/aug/01/climate-endgame-risk-human-extinction-scientists-global-heating-catastrophe
[63] https://insideclimatenews.org/news/17052022/outdoor-air-pollution-health/
[64] https://www.forbes.com/sites/jamesconca/2017/10/10/why-arent-renewables-decreasing-germanys-carbon-emissions
[65] https://www.theguardian.com/environment/2022/jul/21/revealed-oil-sectors-staggering-profits-last-50-years
[66] https://priceofoil.org/fossil-fuel-industry-influence-in-the-u-s/
[67] https://www.statista.com/statistics/788056/us-oil-and-gas-lobbying-spend-by-party/
[68] https://www.theguardian.com/environment/2020/feb/24/oil-gas-industry-us-lawmakers-campaign-donations-analysis
[69] https://www.greenpeace.org/usa/research/big-oil-money-looms-large-in-competitive-elections/
[70] https://yaleclimateconnections.org/2020/01/fossil-fuel-political-giving-outdistances-renewables-13-to-one/
[71] https://therevolvingdoorproject.org/amid-climate-crisis-biden-stacks-administration-with-fossil-fuel-industry-allies/
[72] https://truthout.org/articles/the-dirty-business-of-coal-how-our-addiction-to-an-18th-century-energy-source-is-killing-us/
[73] https://climateintegrity.org/lie-brary/they-knew
[74] https://www.ucsusa.org/climate/accountability
[75] https://www.desmog.com/2023/04/13/bombshell-1989-shell-memo-features-in-new-court-filing-alleging-climate-deception/