
Kevin Guo, Mechanical Engineering ’16
Toshimitsu Kishi, Mechanical Engineering ’16
Brittany Rupp, Chemical Engineering ’17
Table of Contents
I. Jacobson et al.’s Claims
II. Agriculture
- History
- Damages
- Solutions
- How these solutions help NYS
- Farming Work Force
- Agricultural Sales by County
- Local Farming Decreasing
- Claims
III. Ecology
- Ecological evaluation of infrastructure
- Premature death rate
- Ecological evaluation of natural gas, biofuels and nuclear power
- Conclusion
IV. Land Use
- Claims
- Zoning
- Renewable energy sources
V. Sources
Jacobson Claims
With respect to the claims regarding agriculture, ecology and land use made by Jacobson, et al (2013) the following claims will be evaluated for their feasibility.
Agriculture claims
- There was little to no mention of agriculture in the 2013 study. We will therefore present many of our own claims and proposed changes to the current agricultural system.
Ecology claims
- The infrastructure for all proposed sources of energy are environmentally safe and will not interfere with the ecosystems of the areas where they are implemented. (While this is not a specific claim addressed in any section of the 2013 Jacobson study, it is an assumption made by Jacobson that will be evaluated).
- There are 4,000 premature deaths a year in New York State due to air pollution. (Section 8 of the 2013 Jacobson study).
- Natural Gas, solid and liquid biofuels and nuclear power all present too many negative ecological effects to be included in a long term energy plan. (Section 2 of the 2013 Jacobson study).
Land Use claims
- The following percentages of New York State would need to be set aside for the specified types of energy infrastructure needed to produce the necessary amount of energy to power the whole state. (section 4 of the Jacobson study).
- 0.01% of New York State for Geothermal Energy
- 1.46% of New York State for On shore wind turbines
- 4.62% of New York State for Off shore wind turbines
- 0.85 % of New York State for Solar PV and CSP plants
- 0.45% of New York State for small solar panels. These panels would only be placed on preexisting rooftops and developed spaces.
Agriculture
History
- Ever since the first settlers arrived in the United States, agriculture has been a large component of the economy and livelihood. At that time 9 out of 10 people were farmers. Today American agriculture productivity has tripled, with only 3% of our total labor force being farmers. This increase in efficiency is due to many factors such as fertilizer, pesticides, introduction of farm machinery, development of hybrid strains, and increased knowledge about farm management practices. Unfortunately with this explosion in agriculture productivity, potential degradation in soil and water may occur. (25)
Damages
- Soil erosion
- When lands are over-farmed soil erosion may occur. Soil erosion refers to the loss of soil due to wind and water. Farming accelerates this process be degrading the soil making it easier to be washed or blown away. Degraded soil also lacks nutrients vital for successful crops. Fertilizers can only restore nutrients temporally. They must continue to be added year after year to the crops to provide the nutritional benefits to the soil. It takes up to 300 years to naturally form 1 inch of nutrient rich soil, making soil basically irreplaceable. Erosion also leads to rivers, streams and lakes clogging which effects water supplies, habitats of fish and other aquatic life. (25)
- Chemical damages
- As mentioned, synthetic fertilizers are often used to provide nutrients for crops. Pesticides are often put on crops as well to decrease the number of crops destroyed by insects. The chemicals in these pesticides and fertilizers are then washed away by rain and flow into nearby rivers, lakes and water supplies. (25)
- Agriculture land use
- Farmlands currently cover 38% of the world’s land area and is being expanded. (24) This expansion causes the destruction of existing habitats and the endangerment of the species that live there.
Land Converted for Farm Use
-

Graph of world’s percentage of land converted for farm use in 2000 (WRR is World’s Resources Institute)
You may click on all images to enlarge them or to be brought to their original website.
- Greenhouse gas emissions
- Agriculture practices cause around 14% of the world’s greenhouse gas emissions. (23) Sources of these gases include fertilizers, livestock, wetland rice cultivation, manure management and burning of lands to clear for farmlands
Greenhouse Gas Emissions from Agriculture
-

All greenhouse emissions estimated from the Inventory of U.S. Greenhouse Gas Emissions and Sinks 1990-2013

- Bio Diversity
- Currently agriculture has also lost its genetic diversity, which may be good for the short term to ensure all crops are healthy and the same, but in the long term if something happens that affects crops and animals, most of them will die due to the lack of different genes. So in the long term this idea of genetically altering all species in agriculture to be the same is ill advised. (31)
Solutions
- Soil Erosion
- The use of natural fertilizers is better and less expensive for farmers to use than synthetic fertilizers. Natural fertilizers provide better nutrients for the soil, help soil retain more water, and helps prevent erosion. In addition to this farmers can adopted the method of conservation tillage, which cuts soil and water losses by leaving a protective crop residue on the soil surface to protect soil from wind and rain.
- Chemical Damages
- The use of organic pest control instead of pesticides or chemicals. Organic pest control is far less polluting. These include bats, spiders, sticky traps, homemade oils or soap remedies, and other insects that will get rid of plant pests.
- Agriculture Land Use
- Ecological Farming, Agriculture that enables communities to produce enough food for themselves. This form of farming leads to increased crop yields of 30% more food per hectare than conventional means. In developing countries this percentage is 80%. (1) Economically it costs less to manage; using natural fertilizers and pest control, and the food grown is usually much healthier and tastes better. Don’t need to use synthetic chemicals that cause pollution.
- Keep agricultural control in the hands of farmer’s not corporate businesses. By keeping everything locally owned, no corporations can influence negative change to these farming practices.
- Currently 2.6 billion people in the world practice ecological farming, that’s about 40% of today’s farmer population (1)
- Bio diverse Farming uses a mix of different crops and plant varieties in a given field. This is a reliable and effective farming method to ensure against climate change or erratic weather changes. The use of one crop in a wide area could lead to detrimental problems if the weather destroyed the fields, but with bio diversity the crops are overall more resilient.
- Greenhouse gas emission
- Many farms like to contain their animals inside buildings that require a lot of energy to regulate the air quality and control the temperature inside. The indoor air needs to be replaced regularly to remove moisture, toxic gases, odors, and dusts. Solar air heaters can be used to replace current energy consuming systems and preheat incoming fresh air instead. With proper planning these systems can also use natural ventilation systems during the summer. The Solar heating systems can also provide the hot water needed to clean pens or equipment. Commercial dairy farms, one of the predominant farms in New York, can consume up to 40% of their total energy consumption on just heating water, solar heating water can be used to satisfy all water heating energy requirements (26). Many commercial greenhouses use the sun as a light source, but unfortunately they still rely on fossil fuels for heating especially in the colder months. Solar greenhouses are designed to use the sun as both a light source and a heating source. A solar greenhouse collects and stores solar energy because of its thermal mass and has sufficient insulation to retain this gathered heat at night or on cloudy days. A solar greenhouse is oriented to maximize southern glazing exposure while the north side has little or no glazing but is well insulated. Gas or oil heaters are available as backup sources. Solar electric, also known as PV systems convert sunlight energy and convert it straight into electricity. Some farms are in areas without utility lines, making PV systems a lot cheaper and a lot easier to maintain as well. PV systems are very reliable and can continue to produce power in all types of weather. On partly cloudy days they can still produce up to 80%, and on extremely overcast days they can still produce up to 25% maximum output. They can survive hail, high winds, and freeze-thaw cycles. (26) PV systems are not difficult to install. Manufacturers of PV systems make sure their products come with literature or telephone service for “do it yourself” customers. The more intricate systems usually come with professional installation with the purchase anyways. And just in case something does go wrong most PV systems come with 20-25 year warranties today (26) The most cost effective water pumping option would have to be PV water pumping systems. These systems are especially well suited for grazing operations to supply water to remote pastures. This system works hardest in the hot summer months when they are needed the most. It has been proven to work in New York for seasonal use. Some other ways PV systems can help the farms in New York is to provide energy for lighting, small motors, and even ventilation.
- Genetic Diversity
- No more genetic engineering of crops, including animals. Biodiversity is important. Organically grown crops tend to contain 10% more dietary antioxidants than their chemically grown counterparts. These antioxidants are known to prevent disease
How do these solutions help the agriculture in NYS
- Dairy farming is the main agriculture use in New York state, and livestock is the main production of GHG emissions. Annual GHG emissions from agricultural sources in New York State range between about 5.3 and 5.4 MMtCO2e during the time period between 1990 and 2030, generally staying stable over time. Enteric fermentation accounted for about 54% (2.9 MMtCO2e) of total agricultural emissions in both 1990 and 2030. The manure management category accounted for 14% (0.8 MMtCO2e) of total agricultural emissions in 1990 and is estimated to account for about 18% (1.0 MMtCO2e) of total agricultural emissions in 2030. The agricultural soils category shows 1990 emissions accounting for 32% (1.7 MMtCO2e) of total agricultural emissions and 2030 emissions estimated to be about 28% (1.5 MMtCO2e) of total agricultural emissions. By these trends it seems that GHG emissions will remain the same after 2015. (54)But it has been calculated that with a wider adoption of existing best practices and technologies in feeding, health and husbandry, and manure management, as well as greater use of currently underutilized technologies such as biogas generators and energy-saving devices, could help the global livestock sector cut its outputs of global warming gases as much as 30 percent by becoming more efficient and reducing energy waste. (53) The global claims can be correlated to a much smaller community of dairy farms as well, therefore it should also be possible to cut GHG emissions by about 30 percent in NYS as well.
Farming work force in New York State
- The principal operators of farms in the state of New York that have farming as their primary occupation number around 20,400 and other primary occupations number around 15,137. Therefore about 43% of our farmers have another occupation besides farming. (42)
- 29,078 principal operator farmers are male and 6,459 are female, with an average age of 57.1 in 2012 (42)
- 143 American Indian or Alaska Native farmers in NYS (42)
- 163 Asian farmers in NYS (42)
- 113 Black or African American farmers in NYS (42)
- 14 Native Hawaiian or Other Pacific Islander farmers in NYS (42)
- 55,346 White farmers in NYS (42)
- 191 More than one race farmers in NYS (42)
- 481 Hispanic or Latino Origin in NYS(42)
Agricultural sales by counties in New York State
- The Finger Lakes region (Genesee, Livingston, Monroe, Ontario, Orleans, Seneca, Wayne, Wyoming, and Yates counties) accounted for nearly 30 percent of the State’s total farm sales. Wyoming County was the State’s largest producer of milk and corn silage (i.e., animal feed), and Wayne County was first in apple production. The region is also known for its 95 wineries. (49)
- The North Country (Clinton, Essex, Franklin, Hamilton, Jefferson, Lewis, and St. Lawrence counties) accounted for 14 percent of statewide sales. The region is the State’s second-largest producer of milk and other dairy products. Jefferson and St. Lawrence were among the State’s top ten agricultural counties in 2007. (49)
- Central New York (Cayuga, Cortland, Madison, Onondaga, and Oswego counties) accounted for 12 percent of agricultural sales statewide. Almost two-thirds of the region’s sales came from milk and other dairy products. Other key products are cattle and calves, grains and beans. Cayuga is a large producer of milk, soybeans and corn. (49)
- The Southern Tier (Broome, Chemung, Chenango, Delaware, Otsego, Schuyler, Steuben, Tioga, and Tompkins counties) accounted for 11 percent of statewide sales, and nearly two-thirds of the region’s sales were from milk and dairy products. Steuben had the most sales in the region. Schuyler has about half of the region’s 54 wineries. (49)
- Western New York (Allegany, Cattaraugus, Chautauqua, Erie, and Niagara counties) accounted for 11 percent of the State’s agricultural sales. Along with milk and dairy, the region is strong in fruit production. The region has 41 wineries, with Chautauqua leading the State in grape production. (49)
- The Capital District (Albany, Columbia, Greene, Rensselaer, Saratoga, Schenectady, Schoharie, Warren, and Washington counties) accounted for 8 percent of New York’s agricultural sales. Milk and other dairy products accounted for more than half the region’s sales. Washington County is one of the State’s top producers of corn silage. (49)
- Suffolk County on Long Island led the State in agricultural sales with more than $240 million in 2007. Suffolk is New York’s top producer of floriculture, pumpkins and sod. The County’s 76 wineries are mostly located on the East End. The Long Island Wine Council estimates that about 1.3 million tourists visit East End wineries annually. (49)
- In the Hudson Valley (Dutchess, Orange, Putnam, Rockland, Sullivan, Ulster, and Westchester counties), Orange County is one of the State’s top producers of vegetables. Ulster County was second in apple production. The region also has 39 wineries, which help attract tourists to the region. (49)
- In the Mohawk Valley (Fulton, Herkimer, Montgomery, and Oneida counties), milk and other dairy products accounted for more than 60 percent of the region’s agricultural sales. Herkimer had one of the State’s highest inventories of bee colonies, pigeons and squab. (49)
Local Farming decreasing
- Farmers talking about why they’re decreasing in number: “I realize that all of us can’t like to do the same thing our parents did. But if a doctor follows a doctor, a farmer follows a farmer, then you build a stronger society,” Riffle says. The average age of the American farmer continues to climb. Less than 2 percent are under 25 years old. The largest segment of the population is 65 years or older. In just the last 10 years, the number of young farmers under 25 has dropped by 34,000. Get a bunch of young farm kids together now and few talk about following in their parents’ footsteps. “They see they’ll hardly ever have any vacation in the summertime and all they do is work, work, work,” said Mike Eads, an agricultural student. “They see the risk. I mean, it’s really risky.” “Everything costs so much anymore, there’s no money to be made in farming unless you’re big,” said Rebecca Craycraft, another agriculture student. Clearly, modern efficiency has eliminated the need for as many farmers. Back in 1940, one farmer fed 19 mouths. By 1960, it was 46. By 1980, a farmer’s labor fed 115 people. Today, a farmer can feed 129. But fewer farmers and bigger farms will be doing the feeding. (47)
- The family farmer is a dying breed, according to USDA. Every year the agency reports a decline in the number of farming operations across the country, and it’s a problem in Missouri, too. Between 2009 and 2011, Missouri lost 1,500 farms and 200,000 acres of farmland. (43)
- An entire way of life is rapidly dying right in front of our eyes. The family farm is being systematically wiped out of existence in America, and big agribusiness and the federal government both have blood all over their hands. According to the U.S. Department of Agriculture, the number of farms in the United States has fallen from about 6.8 million in 1935 to only about 2 million today. That doesn’t mean that there is less farming going on. U.S. farms are producing more than ever. But what it does mean is that farming is increasingly becoming dominated by the big boys. The rules of the game have been tilted in favor of big agribusiness so dramatically that most small farmers find that they simply cannot compete anymore. Back in 1900, about 39 percent of the U.S. population worked on farms. At this point, only about 2 percent of all Americans now live on farms. Big agribusiness, the food processing conglomerates, and big seed companies such as Monsanto completely dominate the industry. Unless something dramatic is done, the family farm is going to continue to be wiped out of existence. Unfortunately, it does not look like things are going to turn around any time soon. (48) The way that the farming industry is structured today, it is simply not economically feasible to operate a small family farm. According to Farm Aid, every week approximately 330 farmers leave their land for good. (48) Many old timers are trying to hang on for as long as they can. A very large percentage of family farmers are in their fifties, sixties or seventies at this point. Today, only about 6 percent of all farmers are under the age of 35. Most young people these days are not too eager to choose farming as a career. A lot of young adults that grew up on family farms have decided that investing hundreds of thousands of dollars in a business that requires you to work 12 hours or more per day most of the year for very meager wages is simply not worth it. In recent years, many family farmers have been forced to find second jobs in order to support their families. Many farm families are constantly on the verge of financial ruin. It is a really tough life for many of them. Government planning on making regulations that ban children from doing farm chores, another way they are killing the family farm business (48)
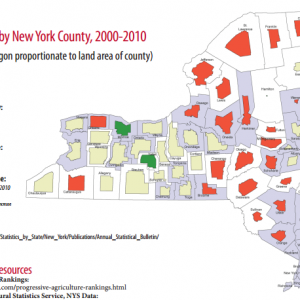
How has this affected New York State’s local farming
Map showing farm land decreases and increases by County
Our own claims
- All agriculture in New York State will use photo-voltaic systems as their main source of energy by 2030
- In 2014, $451 million was invested on solar installations in New York. This represents a 33% increase over the previous year, and is expected to grow again this year.
- Prices for installing solar voltaic systems have been dropping steadily, 8% since last year and 49% since 2010
- The New York Public Service Commission (PSC) recently announced a 10-year $1 billion commitment to developing a self-sustaining solar market in New York State; the program will lead to 3,000MW of PV installations across New York State by 2022. (27)
- Greenhouse gas emissions from agricultural practices will decrease by more than 30% by 2030
- The replacement of current energy practices with photo-voltaic systems can reduce up to 40% of the energy. Assuming more than half the energy replaced would have been relying on natural gases and better agricultural practices are used. (26)
- By 2030 the amount of land used for farming will decrease by about 14%
- From 2002 to 2012 the amount of land that changed from being farm land was about 9%, if current trends continue this equates to about .9% of farm land dissapears every year. (28)
Ecology
Claim: The infrastructure for all proposed sources of energy are environmentally safe and will not interfere with the ecosystems of the areas where they are implemented. (While this is not a specific claim addressed in any section of the 2013 Jacobson study, it is an assumption made by Jacobson that will be evaluated).
The NYS Energy plan is focus on implementing new technology to harvest solar, wind, and hydro power. Since this project’s goal is to implement new methods and technology to preserve the environment, all of the infrastructure for the proposed sources of energy should be environmentally safe and will not interfere with the ecosystems of the areas where they are implemented. As a disclaimer, there will a sunk cost for construction with respect to air pollution produced. However the long term benefits of producing clean energy should compensate for these sunk cost
Wind turbines
Due to the design of wind turbines, they consume a small percentage of land. However they do consume a large amount of air space. The majority of this air space was previously used by birds and bats. Therefore installing wind turbines does impact avian life. The impacts include mortality rate due to collisions, barrier effect, and displacement due to disturbance and habitat loss (9).
- Impacts on avian life
- Birds lack the ability to navigate around man made infrastructure, as can be seen by the number of birds colliding into windows and buildings. They therefore also lack the ability the navigate around turbines, especially when moving. It is estimated that between 140,000 and 328,000 birds die each year from collisions with wind turbines (46). Other studies cited though have recommended methods for decreasing this rate. It has found that bats tend to move during low wind speeds. It is therefore recommended to not have wind turbines move during low wind speeds (10). To also reduce collisions by preventing the barrier effect it is recommended that wind turbines are all aligned in the same direction, in in close clusters, perpendicular to the flight path with corridors to allow birds to fly through the turbines (9). To avoid disturbances and habitat loss construction should try not to disturb the habitat. Wind turbines should be placed in fields as to not destroy the lands surrounding the turbine during construction.
- Human health effect
- Wind turbines will produce a low frequency noise when in motion. While people may be concerned that there are negative health effects to being exposed to this noise there has been no evidence able to prove that there are negative effects (11). Humans are in fact exposed to many different frequencies on a daily basis, radios, television exc… It has also not been able to be proven that these sources of noise cause negative effects to human health. In addition only 4-10 % of people found this level of noise to be disturbing. This annoyance can be decreased by not placing wind turbines near populated areas. Shadow flickers from turbines may also produce annoyance and in rare cases my cause an epileptic seizure. This can be prevented by those who are prone to seizures avoiding these areas.
Offshore wind compose the largest part of the proposed NYS Energy Plan. It is therefore more even more important to ensure that the infrastructure is environmentally safe given the large number of turbines that will be constructed. Fortunately offshore wind farms have already been implemented in areas like Denmark and extensive case studies have been performed on them.
- Effects on sea life
- The extent that offshore wind turbines would effect sea life depends on two factors, the way the construction is performed and the type of sea life that lives in that area. Fortunately due to the high traffic in the waters surrounding New York, most sea life will be accustomed to activity and man made infrastructure. The construction of the proposed wind turbines though could do damage to the bedrock and cause injuries to sea life. Therefore in addition to these recommendations there should be environmental monitoring of the area before, after and during construction.
- Recommendations (7)
- Due to sea water, tidal currents and increased wind speed in these areas, the wind turbines will be experiencing much more stress and pressure than onshore wind turbines. These wind turbines should then be made sturdier to withstand these forces as damage can pollute the surrounding water and repairs will be costly do to the location of the turbines.
- Before construction a warning signal should be released to scare away all wildlife so that they are not effected by the even louder noises of construction.
- Waste management be strictly enforced and all materials brought to site are accounted for before leaving to ensure no pollution to the site.
- Effects on Avian Life
- As mentioned above wind turbines impose certain threats on avian life. Offshore wind magnified these threats. This is due to the migration flyways of birds. (See diagram below). Most birds follow the coast when migrating. Since the proposed wind turbines will be right along the coast, the increase bird traffic will most likely lead to an increased mortality rate amongst birds. This mortality rate can be decrease though by placing wind turbines farther off the coast where there will be less traffic.
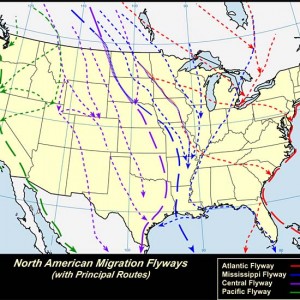
Migration patterns of birds in the United States. Source 8
Solar Energy:
There are a variety of different ways to harness solar energy. They include..
- Rooftop PV panel: Rooftop PV panels pose little environmental impact once installed and operational. They only consume land that is already being used, which does not disturb environments, and produces no waste. However, they do have environmental impacts in construction and disposal. Using current practices, the construction of solar panels will require carbon dioxide and other emissions to be produced in the process of creating the needed energy. This will be reduced once the proper infrastructure is in place to produce energy using renewable resources. The construction of the panel and the materials needed propose a much harder impact to correct for. Many different acids are needed to clean and purify the semiconductors in the panels (13) and materials such as crystalline silica are needed to make the semiconductors (14). These materials pose health risk to the workers making the panels and should be dealt with carefully to avoid negative health effects. These panels should be made to last as longer as possible due to the fact that they must be disposed of carefully due to the materials they possess.
- PV plants: PV plants pose all of the same environmental risk stated above with the additional need for land. To reduce the amount of green space consumed to construct these plants, they may e constructed on preexisting brownfield.
- Concentrated Solar plants (CSP): Concentrated solar plants will also require large portions of land to be operated on. Once again this requirement can be reduced by constructing on brown fields. CSP in addition require water to operate. The amount of water needed depends on the technology used. Wet-recirculating technology is considered to be more efficient than dry-cooling technology, however it requires around 625 gallons of water per megawatt-hour of electricity produced (13). Dry-cooling technology is less efficient with efficiency decreasing as temperature rise (14). It does however require up to 90 percent less water to operate because of recycled steam.
Hydroelectric Dams
- Hydroelectric dam effect both wildlife and ecosystems. In terms of wildlife, these dams affect the fish that live in them by preventing them from migrating upstream and downstream and may kill fish if they are caught by turbines. A way of mitigating this effect is by installing fish ladders, as seen below, which allow for fish to still migrate. Also by installing intake screens less fish are likely to be caught by turbines. (51)
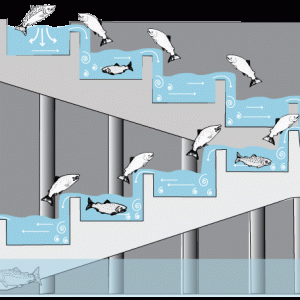
Diagram of a fish ladder. Source (50)
-
Hydroelectric dams should be continually monitored to ensure that they are letting out a sufficient amount of water so that areas downstream do not dry out. Water collect by dams also tends to be low in oxygen if it is let sit too long. Therefore dams should contain aerating turbines that return oxygen to the water. (51)

Claim: There are 4,000 premature deaths a year in New York State due to air pollution. (Section 8 of the 2013 Jacobson study)
History
- Premature deaths are cause by either ozone or particle pollution. Particle pollution are approximately 2.5 microns in diameter and are therefore referred to as PM2.5. (For size reference see image below). This small particle size means that these particles can slip past our bodies natural defenses for other air pollutants such as coughing or sneezing. They effect health by being breathed in, entering our lungs and then passing into our blood stream and displacing oxygen molecules (18). This can cause respiratory and cardiovascular problems with has full body impacts. Children and adults are more prone to problems due to their weaker immune systems and also because children are still developing (19). Pollution can cause short term and long term effects. If pollution sharply increases for a day people will suffer from immediate problem such as asthma attacks. If people are exposed to pollutants long term they may experience permanent damage and may develop cancer (18). Therefore air pollution increases the premature death rate.
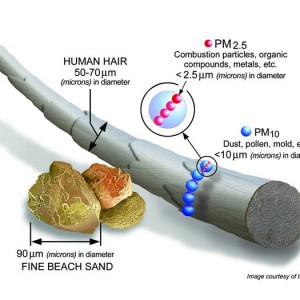
Particle size reference. Source U.S. EPA
In his study, Jacobson recognizes two ways of calculating mortality rate, top-down and bottom-up.
Top down
- The top-down approach finds the total number of premature deaths due to air pollution in the United States and multiples it by the percentage of the population that comes from New York State to find the number of premature death in New York States. As Jacobson mentions in his paper this method is prone to errors due to the fact that air pollution is not equal in all parts of the country. Therefore mortality rate will also differ in different parts of the country, as can be seen in the map below. This method is therefore not accurate.
Below are maps of the estimated annual mortality rate due to air pollutant (17).
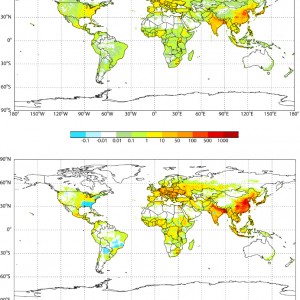
Current premature mortality due to anthropogenic air pollution (2000–1850), in deaths yr−1 (1000 km2)−1l, for (top) ozone (respiratory mortality) and (bottom) PM2.5. Source 17
Bottom-Up
- The Bottom up approach finds the amount of ozone and PM 2.5 for a certain area, NYS, and calculates the premature death rate using this amount, population and other factors described in his 2010 study. The equation both Jacobson and Caiazzo (44) use in there studies is below.
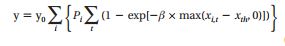
Please click on the picture for the full equation
- In this equation y is the premature death rate, yo is the current death rate, beta is a constant based on the area of the study, xi is the concentration of pollutants, xth is threshold concentration and P is the population.
- Using this information we can predict a more accurate death rate from PM2.5 based on more accurate data. The equation above show that there is a direct correlation between factors such as PM2.5 particles death rate and the population premature death rate. Therefore if any of these factors were to increase the premature death rate would increase and if any decreased, the premature death rate would decrease. The table below shows population (20) (34) and PM2.5 (20) (33) amounts for various regions in NYS . This table shows that while population has stayed relatively the same, the DEC has recorded a decreasing amount of PM2.5. In addition the death rate for 2010 was found to be 799 moralities/yr 100,000 (45) which is less than the 833 moralities/yr per 100,000. This evidence therefore concludes that the premature death rate due to PM2.5 has decreased from 2006-2010 as the PM2.5 amount decreased. There may be some inaccuracies though due to less PM2.5 data in 2010 than 2006 due to the shutdown of some monitoring centers. Jacobson also found a small percentage of premature deaths to be attributed to by ozone. Jacobson set the threshold for premature mortality at 35 ppb. Since our current ozone levels do not cross over this threshold often (35), it can be assumed that very few to no premature deaths can be attributed to ozone.
Population and PM2.5 amounts for various regions in NYS
| Region | 2006 Population | PM2.5 (ug/m^3LC) | 2010 Population | PM2.5 (ug/m^3LC) | |
| 1 | 2,833,000 | 10.6 | 2,832,882 | 8.7 | |
| 2 | 8,176,000 | 13.0 | 8,175,133 | 10.4 | |
| 3 | 2,291,000 | 10.2 | 2,290,851 | 8.7 | |
| 4 | 923,000 | 10.3 | 923,884 | 7.9 | |
| 5 | 583,000 | 6.5 | 581,994 | 4.4 | |
| 6 | 555,000 | 7.6 | 554,657 | 6 | |
| 7 | 1,195,000 | 9.1 | 1,195,705 | 7.8 | |
| 8 | 1,380,000 | 9.1 | 1,381,164 | 7.8 | |
| 9 | 1,441,000 | 9.7 | 1,441,832 | 8.8 | |
Map of NYS showing regions as defined above
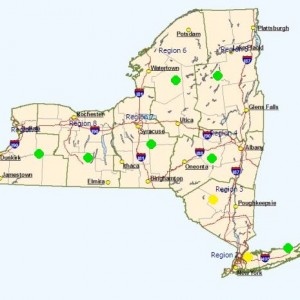
NYS showing regions as defined above. Source 35
Claim: Natural Gas, solid and liquid biofuels and nuclear power all present too many negative ecological effects to be included in a long term energy plan. (Section 2 of the Jacobson study)
Natural Gas
- Natural gas poses many negative ecological effects. Mining for gas can destroy the surrounding environment and transport requires energy which is often done through burning of those resources. When burned, natural gas produces 1135 lbs/MWh of carbon dioxide, 0.1 lbs/MWh of sulfur dioxide, and 1.7 lbs/MWh of nitrogen oxides (36). Burning natural gas also produces methane which can be capture however unlikely to be completely capture. Even though this produces less pollution than methods like coal, it is more environmentally friendly to just use completely pollutant free forms of energy. Therefore natural gas has been eliminated from the proposed energy plan.
Biofuels
- Jacobson cites two reasons as to why biofuels were not included in the long term NYS energy plan. The first was that it requires much more land area to produce as compared to electricity. The second being the combustion effects still produce air pollution and health effects (20). The NYSERDA (New York State Energy Research and
Development Authority) plan contradicts Jacobson by including biofuels in it’s NYS energy plan. Their reason for this decision are biomasses are already being produced and therefore should be use to assist in producing energy for NYS needs. They do not however “include any primary research or detailed analysis of air emissions from biofuel combustion” (21). Because of this release of air pollutants during combustion, biomass should not be used as a permanent solution. However since it produces less pollutants than other sources such as coal, it may be used as a transition fuels helping to eliminate coal and oil before being phased out as we move to a completely 100% WWS system. Solid biofuels can then be allowed to be composed and made into fertilizers for use on farms.
Nuclear Power
- Nuclear power was eliminated from the plan due to the rarity of the materials used and the toxicity of the materials produced. Nuclear material are radioactive. When humans experience long term radiation, our DNA can suffer from mutation which can be passed to offspring and may trigger cancer (30). In addition past nuclear accidents have demonstrated the significant damage that can be done in the event of a nuclear accident. (See graph below for frequency of these accidents). Accidents such as Chernobyl which killed at least 4056 people, the death toll based on long term effects is larger, and cost about $7 billion in property damage (29) and the Fukushima for which the death toll and property damage is still being calculated. While these nuclear accidents are not always as sever as Chernobyl they have accumulated a larger death toll and cost in property damage over the years making them unwise to include in a long term plan.

Energy accident frequency by decade and source, 1907-2007. Source 29.
Conclusion
In conclusion, the proposed infrastructure from the Jacobson study can produce negative ecological effects. We should therefore introduce the methods mentioned above as to mitigate the negative effects and monitor the areas were this technology is implemented to check for damages. With all these technologies, there will be a carbon and air pollution sunk cost for construction. However the long term benefits of producing clean energy should compensate for these sunk cost. Jacobson claim that there are 4,000 premature deaths in New York State due to air pollution has been proven to be a higher estimate than the current premature death rate because of the decrease in air pollution and the overall death rate over the last few years. Lastly, we agree with Jacobson claims that natural gas, solid and liquid biofuels and nuclear power all present too many negative ecological effects to be included in a long term energy plan. These sources produce air pollutants, and radioactive materials in the case of nuclear power, and therefore should be eliminated from use once the technology and support to switch over to 100% wind water and solar energy is produced.
Land Use
Claim: The following percentages of New York State would need to be set aside for the specified types of energy infrastructure needed to produce the necessary amount of energy to power the whole state. (section 4 of the Jacobson study).
-
- 0.01% of New York State for Geothermal Energy
- 1.46% of New York State for On shore wind turbines
- 4.62% of New York State for Off shore wind turbines
- 0.85 % of New York State for Solar PV and CSP plants
- 0.45% of New York State for small solar panels.


Zoning:
- Zones are what municipalities divide their land into and place different regulations as to what can and cannot happen on said land.
- The regulations for each municipality are available publicly and are subject to change.
Geothermal:
Although Geothermal Power Plants may not be feasible in New York State, Geothermal energy can be harnessed to heat homes in the form of open-loop, closed-loop, or standing column systems.
- The NYS Department of Environmental Conservation has a list of regulations set on Geothermal Wells (37)
- Registration and certification from the Division of Water is required for drilling and pump installation for open-loop or standing column systems.
- Registration is not required for closed-loop geothermal systems with boreholes drilled up to 500 feet.
- Because of the vertical nature of Geothermal sites, and because regulations do not force upon lateral development, 0.01% of New York State can be allotted to Geothermal Energy. The justification for whether 0.01% of NYS would be needed was not explored.
On-Shore Wind:
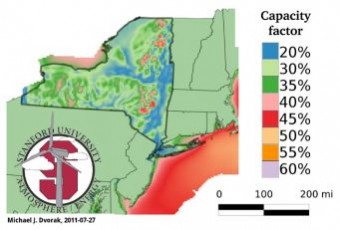
Aside from regions near the Great Lakes and Atlantic Ocean, the area with the highest wind energy potential seems to be around the Catskill mountains.
- Wind Turbines are suspect to zoning regulations that force an increased amount of land usage, as seen in zoning regulations proposed in Delaware County (38)
- A 95 meter 5 MW turbine model was used to verify if 4020 turbines could fit on the land. (39)
- This would take up 16.47 square miles.
- A 63 x 64 grid was used to estimate the amount of square miles this would take up.
- Note that a portion of the Catskill Mountains is part of the Catskill Park which is protected by the government.
- A 16.47 square mile portion of the land available.
- This amount is significantly less than 1.46% of New York State’s land.

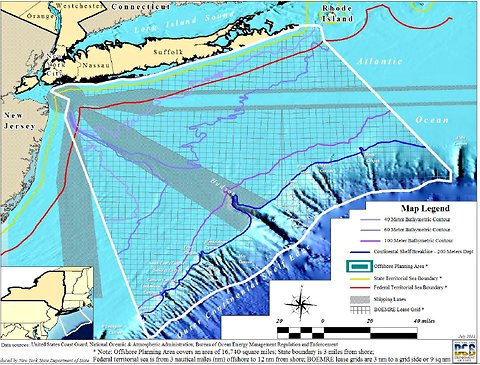
Offshore wind:
The capacity map looks toward the Long Island offshore area for high wind capacity.
- New York State owns the rights to land up to 3 nautical miles offshore
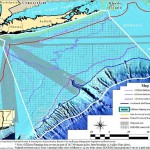
- Offshore lands require a lease to be granted by the Bureau of Ocean Energy Management (40)
- Although there is no justification that 4.62% of New York State needs to be set aside, as the map shows there is at least 2520 sq miles, roughly 4.62% of New York available for lease.
Solar PV:
- New York State allows for local governments to enact solar rights to encourage the use of solar energy. (41)
- Solar Rights are a citizen’s right to the solar power that can be harvested on their property
- Although solar rights encourage the use of solar power among communities and municipalities, they also conflict with potential growth with regards to the environment or infrastructure.
- Buildings, trees and such can be seen as obstructing an individual’s solar rights.
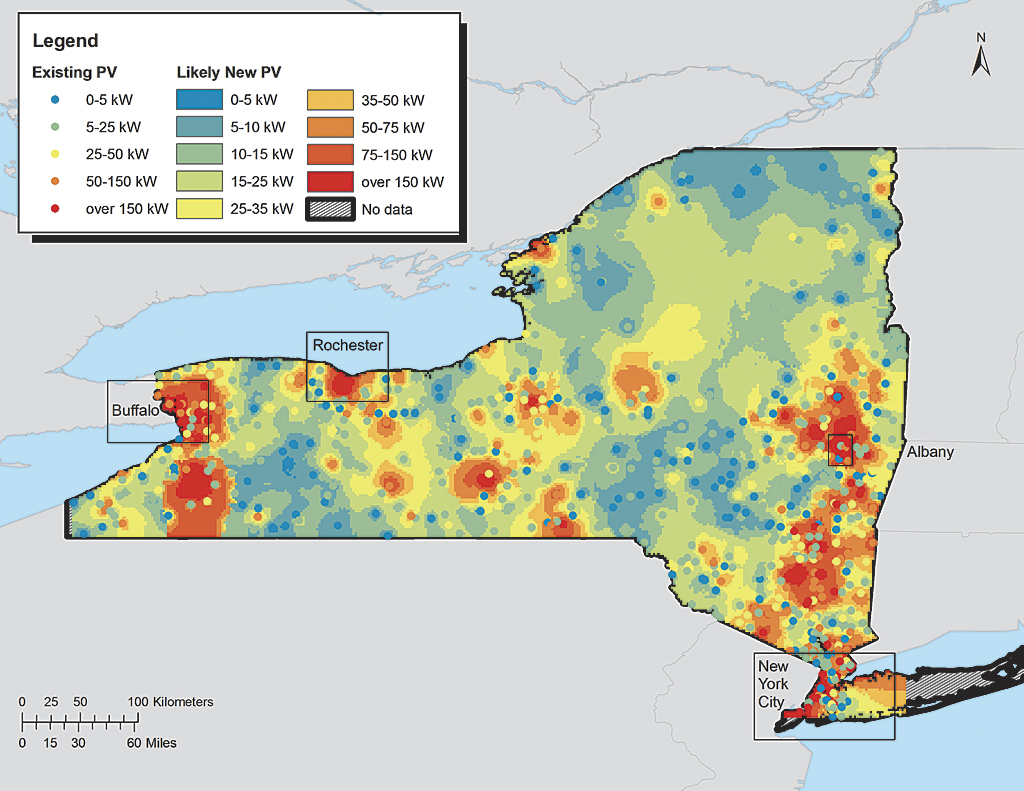
- A New York State map of Solar Photo-voltaic / Concentrated Solar Power potential overlapped over current Photo-voltaic sources.
- The claim that 0.85% of New York State will need to be set aside for solar based plants is not explored, however at least 0.85% of New York State is viable according to the potential map for solar based energy plants.
Conclusion: Although regulations may alter the actual amount of land used, there is still enough land in NYS to appropriate to Geothermal and WWS energy.
Sources
1. http://www.greenpeace.org/international/en/campaigns/agriculture/solution-ecological-farming/
2. http://www.gpo.gov/fdsys/pkg/FR-2001-01-12/html/01-1.htm
4. http://www.boem.gov/Federal-Offshore-Lands/
5. http://www.useful-community-development.org/zoning-regulations.html
6. https://oeaaa.faa.gov/oeaaa/external/searchAction.jsp?action=showWindTurbineFAQs
8. http://www.birdnature.com/allflyways.html
9. http://onlinelibrary.wiley.com/doi/10.1111/j.1474-919X.2006.00516.x/full
11. http://www.health.gov.on.ca/en/common/ministry/publications/reports/wind_turbine/wind_turbine.pdf
12. http://www.sciencedirect.com/science/article/pii/S0960148108004217
14. http://www.oregon.gov/ODOT/HWY/OIPP/docs/SafetyConcernsPVPanels012510.pdf?ga=t
15. http://www.solareis.anl.gov/guide/solar/csp/
16. http://www1.eere.energy.gov/solar/pdfs/csp_water_study.pdf
17. http://iopscience.iop.org/1748-9326/8/3/034005/article
18. http://www.stateoftheair.org/2014/health-risks/health-risks-particle.html
19. http://www.ncbi.nlm.nih.gov/pmc/articles/PMC1470072/?page=3
20. http://www.sciencedirect.com/science/article/pii/S0301421513001213
21. Energy Efficiency and Renewable Energy Potential Study of New York State Volume 3: Renewable Energy Methodology and Detailed Results
22. http://www.pnas.org/content/109/17/6435.full
23. http://www.epa.gov/climatechange/ghgemissions/global.html
24. http://wwf.panda.org/what_we_do/footprint/agriculture/impacts/habitat_loss/
25. http://psep.cce.cornell.edu/facts-slides-self/facts/mod-ag-grw85.aspx
27. http://www.seia.org/state-solar-policy/new-york
28. http://pad.human.cornell.edu/NYMinutes/Minutes/NYMinute53.pdf
29. http://www.sciencedirect.com/science/article/pii/S0301421508000529
30. http://www.epa.gov/radiation/understand/health_effects.html
31. http://wwf.panda.org/what_we_do/footprint/agriculture/impacts/genetic_erosion/
32. http://web.stanford.edu/group/efmh/jacobson/Articles/V/es903018m.pdf
33. http://www.dec.ny.gov/docs/air_pdf/pm25summarythru4q11.pdf
34. http://factfinder.census.gov/faces/tableservices/jsf/pages/productview.xhtml?src=bkmk
35. http://www.dec.ny.gov/airmon/regionMap.php?national
36. http://www.epa.gov/cleanenergy/energy-and-you/affect/natural-gas.html
37. http://www.dec.ny.gov/lands/61176.html
38. http://www.dcrpc.org/files/Wind_Turbine_Language.pdf
40. http://www.boem.gov/Regulatory-Development-Policy-and-Guidelines/
42. http://www.nass.usda.gov/Quick_Stats/Ag_Overview/stateOverview.php?state=NEW%20YORK
43. http://beefmagazine.com/people/are-family-farms-dying
44. http://www.sciencedirect.com/science/article/pii/S1352231013004548
45. http://www.cdc.gov/nchs/data/nvsr/nvsr60/nvsr60_04.pdf
47. http://www.cnn.com/US/9611/17/young.farmers/
49. http://http//www.lifb.com/Portals/1/Dinapoli.pdf
50. http://www.westcoast.fisheries.noaa.gov/fish_passage/about_dams_and_fish/fish_ladders.html
53. http://www.fao.org/news/story/en/item/197608/icode/